
-
Mail us:
editor@raftpubs.org
Indexing & Abstracting
Full Text
Research ArticleDOI Number : 10.36811/ojprm.2020.110009Article Views : 5Article Downloads : 4
Relationship between the COPD assessment test (CAT) and respiratory function characteristics of North African stable COPD patients
Sonia Rouatbi1-3* , Rania Souid1-3, Ichraf Anane1-3, Ines Ghannouchi1-3, Mohamed Mahjoub5, Imene Gargouri4 and Helmi Ben saad1-3
1Department of Physiology and Functional Explorations, Farhat HACHED Hospital, Sousse, Tunisia
2Laboratory of Physiology. Faculty of Medicine of Sousse, University of Sousse, Sousse, Tunisia
3Heart Failure (LR12SP09) Research Laboratory, Farhat HACHED Hospital, Sousse, Tunisia
4Department of Pulmonology-Allergology, Farhat HACHED Hospital, Sousse. Tunisia
5Department of Hospital Hygiene, University Hospital Farhat ached, Sousse, Tunisia
*Corresponding Author: Rouatbi Sonia, Laboratory of Physiology, Faculty of Medicine of Sousse, Street Mohamed KAROUI, Sousse 4000, Tunisia, Tel: +216 73 222 600; Fax: +216 73 224 899; Email: sonia.rouatbi@gmail.com
Article Information
Aritcle Type: Research Article
Citation: Sonia Rouatbi, Rania Souid, Ichraf Anane, et al. 2020. Relationship between the COPD assessment test (CAT) and respiratory function characteristics of North African stable COPD patients. Open J Pulm Respir Med. 2: 15-27.
Copyright: This is an open-access article distributed under the terms of the Creative Commons Attribution License, which permits unrestricted use, distribution, and reproduction in any medium, provided the original author and source are credited. Copyright © 2020; Sonia Rouatbi
Publication history:
Received date: 20 February, 2020Accepted date: 09 March, 2020
Published date: 11 March, 2020
Abstract
Introduction: The COPD Assessment Test (CAT) is a simple method for assessing the impact of COPD on the patient`s health which is not validated with North African COPD patients.
Objective: To determine the relationship between the CAT score and the SGRQ, anthropometric, dyspnea, severity of airflow obstruction and Global Initiative for Chronic Obstructive Lung Disease (GOLD) stages in stable COPD patients.
Material and Methods: It is a cross-sectional observational study. It consists of a convenience sample of COPD and Smokers subjects aged more than 30 years. Dyspnea was evaluated according to the modified British medical research council (mMRC) 4). Arabic versions of the SGRQ and CAT questionnaires were used. Spirometry was performed in accordance with international standards. Obstructive ventilator defect (OVD) grades and GOLD grades were identified.
Results: A total sample of 150 (121 COPD) was collected. A negative correlation was found between CAT score and anthropometric and all functional parameters in the total sample. Correlations between CAT score and mMRC score, pulmonary age and SGRQ score were found in COPD group (p<0.01). CAT score correlated with OVD and GOLD grades, severe COPD (GOLD 3 and 4) had higher CAT scores.
Conclusion: There is a strong relationship between CAT score and clinical and functional COPD components.
Impact of this research on clinical medicine and basic science: COPD is a complex disease with multiple consequences which can impede the quality of life of patients. The latter can be evaluated by specific questionnaires. The most used questionnaire is St. George’s Respiratory Questionnaire (SGRQ). However, this health status measure is long and not practical for clinical routine use. Therefore, recently a new simple system evaluating health status was developed. It is the COPD Assessment Test (CAT), which was approved, in its French, English and Arabic version. It is a simple method for assessing the impact of COPD on the patient`s health. CAT is composed of only eight questions and a key is not needed to calculate a score. To our own knowledge, there are no studies about CAT scoring in and its relation with clinical and respiratory function characteristics in North Africa.
Keywords: COPD- CAT score- SGRQ-FEV1- Spirometry
Introduction
Chronic Obstructive Pulmonary Disease (COPD) represents an important public health challenge [1-3]. COPD is a condition with persistent airflow limitation and systemic inflammation affecting the lungs and other organs and impairing quality of life by several mechanisms [4,5]. Clinically, COPD is characterized by cough, dyspnea and sputum production. To make the diagnosis in this clinical context, spirometry is required [6]. On the other hand, COPD is a complex disease with multiple consequences including breathlessness, exercise limitation, muscle wasting, weight loss, coronary artery disease and other systemic inflammatory effects [7,8]. All of these consequences can impede the quality of life of COPD patients. The most used questionnaire to assess quality of life is St. George’s Respiratory Questionnaire (SGRQ) [9]. SGRQ is a valid, reliable tool to evaluate health-related quality of life. However, this health status measure is long and not practical for clinical routine use [9]. Therefore, recently a new simple system evaluating health status is developed. It is the COPD Assessment Test (CAT). It is approved by many studies to evaluate the impact of COPD on health status [10]. CAT is composed of only eight questions and a key is not needed to calculate a score [11,7]. To our knowledge, there are no studies about CAT scoring in North African COPD patients and its relation with socio-economic level, anthropometric, clinical and respiratory function characteristics. Therefore, the aim of this study is to determine the relationship between the CAT score and SGRQ score, clinical characteristics, severity of airflow limitation and Global Initiative for Chronic Obstructive Lung Disease (GOLD) stages in stable Tunisian COPD Patients.
Population and Methods
Study design
It is a cross-sectional observational study spread over 12 months. Study design consists of a convenience sample of COPD and healthy smokers ‘Tunisian subjects aged more than 30 years (Arab race) from the region of Sousse (Tunisia). Approval for the study was obtained from the Hospital ethics committee (Farhat-HACHED-Hospital-ethics committee). A written informed consent was obtained from all subjects.
Sample size
The sample size for correlation study was calculated according to the following predictive equation [12]:
Z/2 was the normal deviates for type I error (significance level at 99.99, Z?/2 = 3.29) Z1-β was the power of the study at 99% (Z1-β =2.33). According to the literature [13]. the «r» between the CAT total score and postBD FEV1 (%) was equal to «-0.55». According the previous equation, 105 stable COPD are needed. The assumption of 20% for non-inclusion criteria gives a revised sample of 131 COPD patients (131 = 105/ (1.0-0.20)).
Subjects
COPD group: The inclusion criteria for COPD patients were as follows: age>30 years and the COPD spirometry criteria of the GOLD and the American Thoracic Society/European Respiratory Society (ATS/ERS) guidelines [13,14]. Non-inclusion criteria were severe exacerbation of COPD [14], severe cardiac diseases, asthma, and other respiratory disorders and a recent surgery.
Control group: The inclusion criteria of the control group were: Age > 30, healthy-smokers and FEV1/FVC postBD ratio >0.7 [15]. The non-inclusion criteria are similar to those of the COPD group.
Collected data and applied definitions
Medical questionnaire: The questions, asked in Arabic, were gathered from the ATS medical questionnaire [16].
Demographic data: Age (yrs.) was taken as the number of complete years from birth to the date of the study [17]. Height (±0.1m) and weight (±1kg) were measured with a mechanical scale with heels joined, and back straight. Body mass index (BMI=weight/height2) was calculated [18]: underweight (BMI < 18.5 kg/m2), normal weight (18.5 kg/m2 to 24.9 kg/m2), overweight (25.0 kg/m2 to 29.9 kg/m2) and obesity (BMI ≥ 30.0 kg/m2).
Tobacco-smoke: Cigarette-smoking (pack-years) were evaluated [19]. Current-smokers were subjects who reported current smoking or quit smoking within 12 months [20].
Respiratory symptoms: Information’s about respiratory symptoms (cough, sputum, wheezing, shortness of breath or dyspnea) and previous respiratory diagnoses were collected. Chronic bronchitis was defined according to ATS criteria as: A history of productive daily cough for 3 consecutive months each year for the past 2 years [21].
Dyspnea was evaluated according to the modified British medical research council (mMRC) scale. The mMRC breathlessness scale comprises five statements that describe almost the entire range of respiratory disability from none (mMRC Grade 0) to almost complete incapacity (mMRC Grade 4) [22].
St. George's Respiratory Questionnaire (SGRQ)
The SGRQ is a standardized self-administrated airway disease-specific questionnaire divided into three subscales: «Symptoms», «Activity» and «Impacts» (respectively, eight, 16 and 26 items). SGRQ scores were calculated using score calculation algorithms. For each subscale and for the overall questionnaire, scores range from zero (no impairment) to 100 (maximum impairment) [23,24]. SGRQ is designed to measure and quantify health status in patients with chronic airflow limitation. It has been shown to correlate with established measures of symptom level, disease activity and disability. An Arabic translated version of the SGRQ was used [25]. The SGRQ was asked by the researcher (Investigator-Doctor).
COPD Assessment Test (CAT)
The validated Arabic Version of the CAT respiratory questionnaire aimed to quantify COPD impact on health status [26]. It is eight items covering symptoms (cough, phlegm on chest and chest tightness) and impact of symptoms (walking up gradients, activities at home, going out, sleep and energy) which is straight forward and rapid to complete. The scale for each question ranges from 0 to 5. The total CAT score was calculated for each subject by summing the points for each variable. CAT has a scoring range from zero to 40. Based on the impact level of disease on health status the CAT score was classified into four groups of low (score<10), medium (10≤score≤20), high (20<score≤30) and very high (score >30) [27].
Spirometry measurements
Spirometry Function Test: According to the international recommendations, spirometry was carried out in the sitting position, and a nose clip was applied [28]. All tests were performed using a spirometer (ZAN 100, Messgerate GmbH, Ober-thulba, Germany). The flow sensor of the spirometer was calibrated daily with a 3-L syringe. All spirometric tests were performed at the same time of the day (between 10h00 and 14h00).
The following parameters were measured before (preBD) and after bronchodilator test: forced vital capacity (FVC (L, %)); 1st second forced expiratory volume (FEV1 (L, %)); FEV1/FVC ratio (absolute value); and maximal mid expiratory flow (MMEF, (L/s, %)) and pulmonary age (Year).The pulmonary age was calculated using a specific reference equation [29]. The results were compared with age- and sex-matched reference values [30]. Obstructive ventilator defect (OVD) was defined as FEV1/FVCpreBD ratio < low limit of normal (LLN). FEV1, MMEF and FVC were considered as abnormal when they were lower than the LLN [30]. The OVD severity classification was based on the preBD FEV1 (% predicted) values [30]: Mild: FEV1 > 70%, Moderate: 60-69%, Moderately severe: 50-59%, Severe: 35-49% and Very severe: < 35%.
Bronchodilator Response Test: The bronchodilator test was done and interpreted according to the international guidelines [30-32] In case of COPD, OVD is partially reversible (there are criteria of a positive bronchodilator response with a postBD FEV1/FVC ratio < 0.70) or fixed (absence of the positive bronchodilator response criteria with a postBD FEV1/FVC ratio < 0.70) [30-32].
COPD diagnosis and classification: COPD diagnosis was retained in front of a postBD FEV1/FVC ratio < 0.70 [14,33]. The severity of airflow limitation in COPD was classified as follows: GOLD1. mild (postBD FEV1 ≥ 80% predicted); GOLD2. moderate (50% ≤ postBD FEV1 < 80% predicted); GOLD3. severe (30% ≤ postBD FEV1 < 50% predicted) and GOLD4. very severe (postBD FEV1 < 30% predicted) [17,27].
Statistical analysis: Demographic and clinical characteristics of patients were summarized descriptively. Preliminary descriptive analysis included frequencies for categorical variables: gender (male/female), and clinical characteristics of the sample (1, 0) and means ± standard deviation (SD) for continuous ones (anthropometric, spirometric and CAT Scores) since the distribution of these dependent variables was normally distributed. Normality was assessed using specific test and report all findings in the results section. A concordance analysis was applied to quantify the association (correlations) between CAT scores and demographic, clinical (SGRQ scores, mMRC, GOLD grades) and preBD and postBD spirometric parameters (FEV1, FVC, FEV1/FVC, FEF25-75 and pulmonary age). Group comparisons were tested using t-tests or Chi-Square test. Statistical analyses were performed using Statistical software (Statistical Kernel version 6; Stat Soft, Paris, France). A p value <0.05 was considered significant in all statistical analyses.
Result
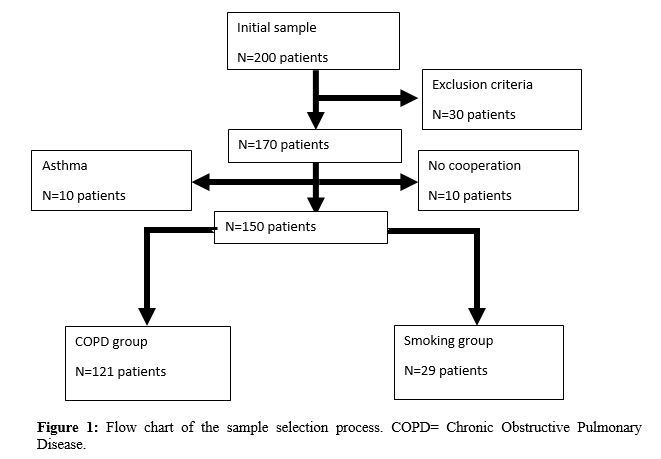
The sample study is formed of 150 subjects. The main encountered difficulties in the selection of COPD patients and healthy smokers were: the no cooperation, the high body mass index that impairs the performance of the spirometric tests, and the exclusion criteria (Figure 1).
Table 1 presented anthropometric, CAT and SGRQ scores of the total sample, COPD group and control group. The main conclusions from Table1 are: CAT and SGRQ scores were higher in COPD group than control group (p<0.05).
|
socio-economic level (N, %) |
low |
137 (92%) |
115 (95%) |
22 (76%) |
|
high |
12 (8%) |
6 (5%) |
7 (24%) |
|
|
school level (N, %) |
low |
102 (68%) |
92 (76%) |
10 (34.5%) |
|
high |
47 (32%) |
29 (24%) |
19 (65.5%) |
|
|
Cough (N, %) |
no |
91 (61%) |
64 (53%) |
27 (93%) |
|
yes |
59 (38%) |
57 (47%) |
2 (7%) |
|
|
Expectoration (N, %) |
no |
88 (59%) |
62 (51%) |
26 (90%) |
|
yes |
62 (41%) |
59 (49%) |
3 (10%) |
|
|
mMRC Dyspnea Grades (N, %) |
0 1 2 3 4 |
11 (7.33%) 75 (50%) 32 (21.33%) 30 (20.00%) 2 (1.33%) |
0 (0%) 57 (47.11%) 32 (26.44%) 30 (24.79%) 2 (1.65%) |
11 (37.93%) 18 (62.07%) 0 (0%) 0 (0%) 0 (0%) |
|
* Significant comparison between COPD and Smokers by T-test SD = standard deviation BMI=body mass index COPD = chronic obstructive pulmonary disease CAT= COPD Assessment Test m: meter N: Number PY: pack-year SGRQ score=St George respiratory questionnaire mMRC=modified British medical research council |
||||
Figure 2 showed a very significant correlation between CAT score and SGRQ score.
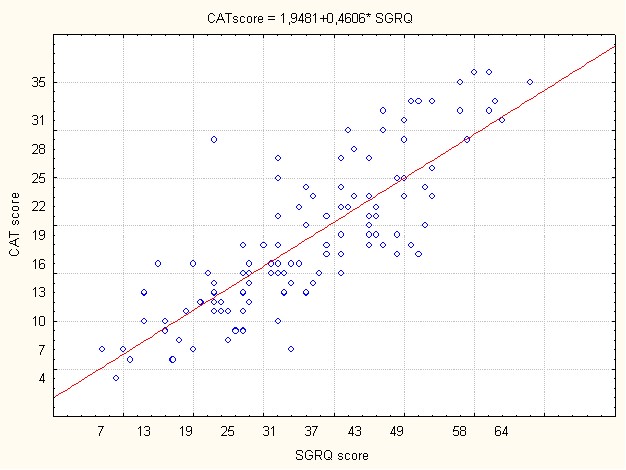
p<0.00001
Figure 2: Correlation between CAT score and SGRQ in COPD group.
COPD= chronic obstructive pulmonary disease group
CAT= COPD Assessment Test
SGRQ score=St George's Respiratory Questionnaire
As Shown in table 2, a negative correlation is found between CAT score and height, weight and BMI in COPD patients (p<0.05).
There is a significant difference between CAT scores according to clinical respiratory symptoms (Cough, sputum and dyspnea mMRC grades) (p<0.05) of COPD when compared to smokers’ groups.
Table 3 presented the main spirometric characteristics of the total sample, COPD and healthy smokers’ groups. Proximal OVD is only present in COPD group. Lung aging is noted in the total sample with an advanced pulmonary age in the COPD group.
The prevalence of moderately-severe to very severe OVD (3-4 and 5 grades) is noted in the total sample. The COPD group presented all OVD grades with the prevalence of moderately severe (grade 3) to very severe OVD (grade 5).85% of COPD patients have a partially reversible OVD. The GOLD 3 and 4 grades are the most represented in the COPD group.80% of the COPD group had moderate to high (2 and 3 CAT classes) impact level of their disease. As shown in table 4, CAT scores are negatively correlated to all spirometry parameters and positively correlated to pulmonary age.
Distribution and comparison of CAT scores according to OVD grades in the COPD group are presented in Figure 3. According to OVD grades, CAT class 2 is the most frequent in all OVD grades of COPD patients. Severe OVD grade is the most frequent in the COPD group with high CAT score.
CAT scores distribution and comparison according to GOLD grades is shown in Figure 4. In GOLD 4 grade, the most presented CAT classes are 2 and 3.
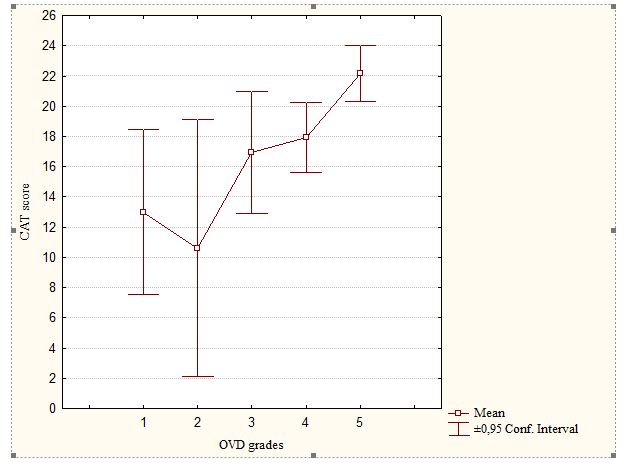
Figure 3: Distribution and comparison of CAT scores according to OVD grades
in COPD Group.
ns: p>0.05: comparaison of CAT scores between OVD grade 1 and respectively 2,3 and 4 grades by T-test.
*: p<0.05: comparaison of CAT scores between OVD grade 1 and 5 by T-test
COPD= chronic obstructive pulmonary disease group
CAT= COPD Assessment Test
OVD: obstructive ventilatory defect
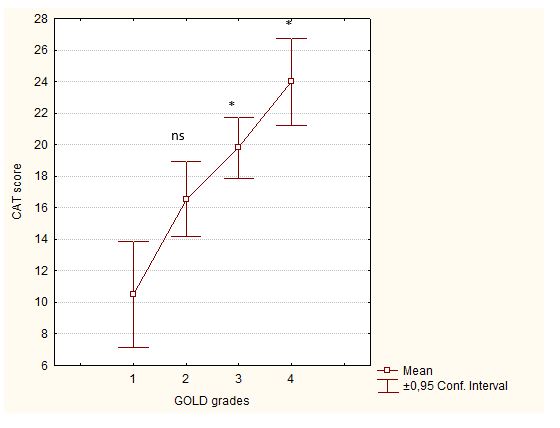
Figure 4: Distribution and comparison of CAT scores according to GOLD classification.
ns: p>0.05: comparaison of CAT scores between GOLD1 and GOLD2 by
T-test.
*: p<0.05: comparaison of CAT scores between GOLD1 and respectively GOLD3 and 4 by T-test
COPD= chronic obstructive pulmonary disease group
CAT= COPD Assessment Test
GOLD: Global initiative for chronic obstructive lung disease
Discussion
The main findings of the present cross-sectional observational study are the presence of positive correlations between CAT score and anthropometric, clinical, and spirometry characteristics in North African COPD patients. An important component of COPD managements is quality of life. SGRQ was the most used and recommended one [14,34]. In the present study, SGRQ score in its Arabic version is used and compared to CAT score [36]. The SGRQ is therefore more complicated to calculate and is lengthy [37-39]. The CAT questionnaire using the classical Arabic version [14], is a short health status tool, which is developed to enable a better communication between COPD patients and physicians [40]. The CAT assesses the health status of patients with COPD by quantifying the impact of common COPD symptoms on the lives of patients [28,40]. This tool was emphasized by GOLD and its use in clinical and research settings has widely increased [40]. In the present study, there is a very significant correlation between CAT and SGRQ scores. This result is similar to that of Sarioglu et al. [34] and other authors (10, 37). The CAT score presented satisfactory discriminative qualities and so it can replace SGRQ in the assessment of quality of life in COPD patients. Dyspnea score measured by mMRC is higher in COPD group than control group as found in the studies of Yoo et al. and Sarioglu et al. [34, 41]. A very significant difference was found between CAT scores according to dyspnea grades 2 and 3 respectively in COPD group. In the same context, the Health-Related Quality of Life in COPD in Europe Study [42] has shown that there was a clear relationship between mMRC grade and health status scores across the whole severity range of the mMRC scale. The CAT score is significantly higher in the COPD group than control group (healthy Smokers), which is consistent with the finding of other studies [11, 34, 41]. Karloh et al. found that there was no significant difference in CAT scores between COPD patients and smokers without COPD [43]. Despite the apparent absence of changes in lung function on spirometry, smokers had impaired health status and respiratory symptoms similar to those observed in COPD patients [43]. So symptomatic smokers with CAT scores above 10 should undergo further pulmonary function tests for a better evaluation of their lung function. One of the most important finding of the current study was the inverse correlation between OVD severity (FEV1preBD, %) and CAT scores (Table4). These results suggest that a lower FEV1 indicates high CAT score and health impairment due to COPD. In the present study, CAT score correlated significantly withhold grades (Figure 3 and Table 6 in supplementary data). Therefore, the present study suggested that COPD severity assessed by the CAT score can be directly related to airflow limitation. On the other hand, and as suggested Ghobadi et al. can employ the CAT questionnaire as a predictor of severity of airway obstruction in COPD patients (Table 5 in supplementary data) [17]. Moreover Sarioglu et al. [34] has shown that as the FEV1 and FVC decreased, the CAT score increased. Shashank Singh et al. [27], confirmed the evident negative correlation between CAT scores and the FEV1% predicted. This study showed that CAT questionnaire is a sensitive, simple, and reliable tool for early recognition and assessing health status in COPD patients.
As recommended by GOLD, the diagnosis of COPD disease was confirmed by the post bronchodilator FEV1/FVC ratio <0.7 [14]. The prevalence of moderate to severe GOLD grades were noted which is similar to the results of other studies [13, 34, 41, 42]. Yoo et al. [41] have used CAT score to identify patients with chronic bronchitis as having worse quality of life than non-chronic bronchitis. Quality of life in patients was confluence by GOLD grades. In the present study, a significant difference was found between GOLD 1 vs. GOLD 3 and 4. Sariogluet al. [34] showed a strong association between CAT and FEV1, FVC and the GOLD spirometric stages. As the FEV1 and FVC decreased, the CAT score increased. These results showed that CAT reflected the severity of COPD [34]. Regarding pulmonary age, we noted a more accelerated lung aging of COPD group than control group. CAT score correlated positively with pulmonary age in the two groups of the study. So, CAT score value can be considered as an indicator of lung aging. Our study has some limitations, the main ones are: First, it is a single center study what explains the small sample size. Second, the low number of smoking control group given their refusal to do spirometry test. Third, COPD is related to other factors (occupational COPD) that are not described in this study. In conclusion, CAT is a test that can be used in the assessment of COPD, since its reliability and validity have been clearly demonstrated. It is strongly recommended to use this test (CAT score) at every pulmonologist consultation.
References
1. Lozano R, Naghavi M, Foreman K, et al. 2012. Global and regional mortality from 235 causes of death for 20 age groups in 1990 and 2010: a systematic analysis for the Global Burden of Disease Study 2010. Lancet. 380: 2095-2128. Ref.: https://www.ncbi.nlm.nih.gov/pubmed/23245604
2. Mathers CD, Loncar D. 2006. Projections of global mortality and burden of disease from 2002 to 2030. PLoS Med. 3: e442. Ref.: https://www.ncbi.nlm.nih.gov/pubmed/17132052
3. Adeloye D, Chua S, Lee C, et al. 2015. Global Health Epidemiology Reference Group (GHERG). Global and regional estimates of COPD prevalence: Systematic review and meta-analysis. J Glob Health. 5: 020415. Ref.: https://www.ncbi.nlm.nih.gov/pubmed/26755942
4. Funk GC, Kirchheiner K, Burghuber OC, et al. 2009. BODE index versus GOLD classification for explaining anxious and depressive symptoms in patients with COPD - a cross-sectional study. Respir Res. 10: 1. Ref.: https://bit.ly/2vRtGJx
5. Fabbri LM, Rabe KF. 2007. From COPD to chronic systemic inflammatory syndrome? 370: 797- 799. Ref.: https://www.ncbi.nlm.nih.gov/pubmed/17765529
6. Buist AS, McBurnie MA, Vollmer WM, et al. 2007. International variation in the prevalence of COPD (the BOLD Study): a population-based prevalence study. 370: 741-750. Ref.: https://www.ncbi.nlm.nih.gov/pubmed/17765523
7. Watz H, Waschki B, Meyer T, et al. 2009. Physical activity in patients with COPD. Eur Respir J. 33: 262-272. Ref.: https://www.ncbi.nlm.nih.gov/pubmed/19010994
8. Euteneuer S, Windisch W, Suchi S, et al. 2006. Health-related quality of life in patients with chronic respiratory failure after long-term mechanical ventilation. Respir Med. 100: 477- 486. Ref.: https://bit.ly/2TAQ17t
9. Jones P, Harding G, Wiklund I, et al. 2009. Improving the process and outcome of care in COPD: development of a standardised assessment tool. Prim Care Respir J. 18: 208-215. Ref.: https://www.ncbi.nlm.nih.gov/pubmed/19690787
10. Jones PW, Harding G, Berry P, et al. 2009. Development and first validation of the COPD Assessment Test. EurRespir J. 34: 648-654. Ref.: https://www.ncbi.nlm.nih.gov/pubmed/19720809
11. Celli BR, Cote CG, Marin JM, et al. 2004. The body-mass index, airflow obstruction, dyspnea, and exercise capacity index in chronic obstructive pulmonary disease. N Engl J Med. 350: 1005- 1012. Ref.: https://bit.ly/2wJSm6M
12. Kang M, Ragan BG, Park JH. 2008. Issues in outcomes research: an overview of randomization techniques for clinical trials. J Athl Train. 43: 215-221. Ref.: https://www.ncbi.nlm.nih.gov/pubmed/18345348
13. Ghobadi H, Ahari SS, Kameli A, et al. 2012. The Relationship between COPD Assessment Test (CAT) Scores and Severity of Airflow Obstruction in Stable COPD Patients. Tanaffos. 11: 22-26. Ref.: https://www.ncbi.nlm.nih.gov/pubmed/25191410
14. Global Strategy for the diagnosis, management, and prevention of chronic obstructive pulmonary disease (2017 Report).
15. Pellegrino R, Viegi G, Brusasco V, et al. 2005. Interpretative strategies for lung function tests. EurRespir J. 26: 948-968. Ref.: https://www.ncbi.nlm.nih.gov/pubmed/16264058
16. Ferris BG. 1978. Epidemiology Standardization Project (American thoracic society). Am Rev Respir Dis. 118: 1-120. Ref.: https://www.ncbi.nlm.nih.gov/pubmed/742764
17. Quanjer PH, Hall GL, Stanojevic S, et al. 2012. Age- and height-based prediction bias in spirometry reference equations. EurRespir J. 40: 190-197. Ref.: https://www.ncbi.nlm.nih.gov/pubmed/22183491
18. Tsai AG, Wadden TA. 2013. In the clinic: obesity. Ann Intern Med.159: ITC3-1-ITC3-15. Ref.: https://www.ncbi.nlm.nih.gov/pubmed/24026335
19. World Health Organization. Obesity and overweight.
20. Liu Y, Pleasants RA, Croft JB, et al. 2015. Smoking duration, respiratory symptoms, and COPD in adults aged ≥45 years with a smoking history. Int J Chron Obstruct Pulmon Dis. 10: 1409-1416. Ref.: https://www.ncbi.nlm.nih.gov/pubmed/26229460
21. American Thoracic Society. 1995. Standards for the diagnosis and care of patients with chronic obstructive pulmonary disease: in patient management of COPD. Am J RespirCrit Care Med. 152: 78-83. Ref.: https://bit.ly/2xoDZFB
22. Fletcher CM, Elmes PC, Fairbairn AS, et al. 1959. The significance of respiratory symptoms and the diagnosis of chronic bronchitis in a working population. Br Med J. 2: 257-266. Ref.: https://www.ncbi.nlm.nih.gov/pubmed/13823475
23. Bouchet C, Guillemin F, Hoang Thi TH, et al. 1996. Validation of the St George’s questionnaire for measuring the quality of life in patients with chronic obstructive pulmonary disease. Rev Mal Respir.13: 43-46. Ref.: https://www.ncbi.nlm.nih.gov/pubmed/8650415
24. Jones PW, Quirk FH, Baveystock CM, et al. 1992. A self-complete-measure of health status for chronic airflow limitation. The St. George’s Respiratory Questionnaire. Am Rev Respir Dis. 145: 1321-1327. Ref.: https://www.ncbi.nlm.nih.gov/pubmed/1595997
25. Khalladi R, Gargouri I, Mahjoub M, et al. 2017. Evaluation of quality of life (QOL) of Tunisians patients with COPD. 73: 231-239. Ref.: https://www.ncbi.nlm.nih.gov/pubmed/29054717
26. COPD assessment test website. 2017. Ref.: https://bit.ly/2PYGCEh
27. Singh S, Daga MK, Hira HS, et al. 2018. Correlation of chronic obstructive pulmonary disease assessment test and clinical chronic obstructive pulmonary disease questionnaire score with BODE index in patients of stable chronic obstructive pulmonary disease. Lung India. 35: 494-498. Ref.: https://www.ncbi.nlm.nih.gov/pubmed/30381559
28. Miller MR, Hankinson J, Brusasco V, et al. 2005. Standardisation of spirometry. EurRespir J.26: 319-338. Ref.: https://www.ncbi.nlm.nih.gov/pubmed/16055882
29. Ben Khelifa M, Ben Saad H. 2018. Which reference equation should be applied to estimate the lungage? Rev Mal Respir. 35: 997-998. Ref.: https://www.ncbi.nlm.nih.gov/pubmed/29784503
30. Miller MR, Hankinson J, Brusasco V, et al. 2005. Standardisation of spirometry. EurRespir J. 26: 319-338. Ref.: https://www.ncbi.nlm.nih.gov/pubmed/16055882
31. Ben Saad H, Ben AttiaSaafi R, Rouatbi S, et al. 2007. Which definition to use when defining reversibility of airway obstruction? Rev Mal Respir. 24: 1107-1115. Ref.: https://www.ncbi.nlm.nih.gov/pubmed/18176387
32. Pellegrino R, Viegi G, Brusasco V, et al. 2005. Interpretative strategies for lung function tests. EurRespir J. 26: 948-968. Ref.: https://www.ncbi.nlm.nih.gov/pubmed/16264058
33. Ben Saad H, Ben Amor L, Ben Mdella S, et al. 2014. The diagnosis of COPD is recommendation dependent. Tunis Med. 92: 474-481. Ref.: https://www.ncbi.nlm.nih.gov/pubmed/25775287
34. Sarioglu N, Hismiogullari AA, Bilen C, et al. 2016. Is the COPD assessment test (CAT) effective in demonstrating the systemic inflammation and other components in COPD? Rev Port PneumolEngl Ed. 22: 11-17. Ref.: https://www.ncbi.nlm.nih.gov/pubmed/26534740
35. Gulart AA, Munari AB, Queiroz APA de, et al. 2017. Does the COPD assessment test reflect functional status in patients with COPD? ChronRespir Dis. 14: 37-44. Ref.: https://www.ncbi.nlm.nih.gov/pubmed/27507835
36. Khalladi R, Gargouri I, Mahjoub M, et al. 2017. Evaluation of quality of life (QOL) of Tunisians patients with COPD. Rev PneumolClin. 73: 231-239. Ref.: https://www.ncbi.nlm.nih.gov/pubmed/29054717
37. Ringbaek T, Martinez G, Lange P. 2012. A comparison of the assessment of quality of life with CAT, CCQ, and SGRQ in COPD patients participating in pulmonary rehabilitation. COPD. 9: 12-15. Ref.: https://www.ncbi.nlm.nih.gov/pubmed/22292593
38. Harper R, Brazier JE, Waterhouse JC, et al. 1997. Comparison of outcome measures for patients with chronic obstructive pulmonary disease (COPD) in an outpatient setting. Thorax. 52: 879-887. Ref.: https://www.ncbi.nlm.nih.gov/pubmed/9404375
39. Tsiligianni IG, Alma HJ, de Jong C, et al. 2016. Investigating sensitivity, specificity, and area under the curve of the Clinical COPD Questionnaire, COPD Assessment Test, and Modified Medical Research Council scale according to GOLD using St George’s Respiratory Questionnaire cutoff 25 (and 20) as reference. Int J ChronObstructPulmon Dis. 11: 1045-1052. Ref.: https://www.ncbi.nlm.nih.gov/pubmed/27274226
40. Kon SS, Canavan JL, Jones SE, et al. 2014. Minimum clinically important difference for the COPD Assessment Test: a prospective analysis. Lancet Respir Med. 2: 195-203. Ref.: https://www.ncbi.nlm.nih.gov/pubmed/24621681
41. Yoo SH, Lee JH, Yoo KH, et al. 2018. Different Pattern of Chronic Obstructive Pulmonary Disease Assessment Test Score between Chronic Bronchitis and Non-chronic Bronchitis Patients. TubercRespir Dis. 81: 228. Ref.: https://www.ncbi.nlm.nih.gov/pubmed/29527842
42. Cheng SL, Lin CH, Wang CC, et al. 2019. Comparison between COPD Assessment Test (CAT) and modified Medical Research Council (mMRC) dyspnea scores for evaluation of clinical symptoms, comorbidities and medical resources utilization in COPD patients. J Formos Med Assoc.118: 429-435. Ref.: https://www.ncbi.nlm.nih.gov/pubmed/30150099
43. Karloh M, Rocha SAV, Pizzichini MMM, et al. 2018. The RespiraFloripa Group. Is the COPD Assessment Test sensitive for differentiating COPD patients from active smokers and nonsmokers without lung function impairment? A population-based study. J Bras Pneumol. 44: 213-219. Ref.: https://www.ncbi.nlm.nih.gov/pubmed/30043888