
-
Mail us:
editor@raftpubs.org
Indexing & Abstracting
Full Text
Research ArticleDOI Number : 10.36811/ojgor.2023.110023Article Views : 0Article Downloads : 1
Induction of Labour: Indications, Techniques and Results at the Hospital Center of Nevers
Thérèse Mikoka1, Remy Kosi1, Aliou Diouf1*, Sege Douvier2 and Philippe Kadhel2
1Nevers Hospital Center, Nevers, France
2CHU de Dijon, Dijon, France
*Corresponding Author: Dr. Aliou DIOUF, Nevers Hospital Center, CHU Dijon Bourgogne, Tel: +33675624581; Email: alioudiouf69@yahoo.com
Article Information
Aritcle Type: Research Article
Citation: Thérèse Mikoka, Remy Kosi, Aliou Diouf, et al. 2023. Induction of Labour: Indications, Techniques and Results at the Hospital Center of Nevers. O J Gyencol Obset Res. 5: 01- 14.
Copyright: This is an open-access article distributed under the terms of the Creative Commons Attribution License, which permits unrestricted use, distribution, and reproduction in any medium, provided the original author and source are credited. Copyright © 2023; Thérèse Mikoka
Publication history:
Received date: 19 March, 2023Accepted date: 25 March, 2023
Published date: 28 March, 2023
Abstract
Introduction: Induction of labor initiation represents the whole methods which lead to a birth of a child without waiting for the startup spontaneous of baby delivery. Many situations can take a practitioner to decide: from medical reasons to the triggering of convenience. The aim is to study the direction, methods and results of labor induction at Nevers agglomeration hospital center (CHAN).
Methods: This transverse prospective study took place at CHAN during the period from January 1 to June 30, 2020 (6 months). It included pregnant women carrying a pregnancy of more than 28 SA with an indication of labor’s induction. Sociodemographic, clinical and therapeutic variables were analyzed. The determinants of the failure of the trigger had been sought.
Results: We recorded on all 138 cases of labor induction out of a total of 563 deliveries, representing a frequency of 24.5%. The women involved were on average 31 years old. Most direction of labor was medical and were marked out for RPM (26,6%), extended pregnancy (19,9%) gestational diabetes (19,1%) and pre-eclampsia (9,2%); the directions of convenience support (5%). The most method used were prostaglandin (a strip of propess) (42.8%) followed by oxytocin use (30%) as well as detachment of membranes (16.7%) as well as Cook Cervical Ripening Balloon at lower percentage (4,3 %). Almost all of the triggers resulted in a vaginal delivery (78.3%) the c- section was reported in 21.7% of cases. The determinants of failure were early amniotomy with defavorable Bishop score and a delay between induction and delivery of more than 9 hours [ORa: 2.6 CI95% (1.5-4.7) p-0.029]. All children were Apgar higher than 6, at the first five minute of life, but among them 6 or 4.3% were referred to the neonatology unit (instrumental extraction, Respiratory distress, obstetric maneuvers).
Conclusion: The induction of labor remains an act of great importance and contributes to the reduction of maternal and/or perinatal mortality and morbidity as well as to the reduction of the rate of caesarean section at NHC.
Keywords: Direction, Methods, Results, NHC
Introduction
Induction of labor is the artificial induction of uterine contractions before their spontaneous onset in a woman who was not previously in labor, with the aim of obtaining a vaginal birth [1]. It is performed either for maternal or fetal indications in order to reduce morbidity and perinatal mortality without increasing maternal morbidity, or for reasons of convenience. The decision to trigger falls within the competence of the obstetrician. Several techniques can be used (mechanical and/or medicinal) [2, 3].
Indeed, induction of labor is becoming more and more common around the world. In developed countries, up to 25% of women benefit from induction of labor, while in developing countries the rates recorded are generally lower, but increasing according to WHO 2015 [4]. Prolonged pregnancy, premature rupture of the membranes as well as maternal or fetal pathology requiring the birth of the child require artificial induction of labor [5].
Its rate has been increasing globally in many countries of the world over the past two decades. Its practice doubled in France between 1980 and 1995, rising from 10.4% to 20.5%. Since then, this rate has been stable. It is 19.7% according to the 2003 perinatal survey [6]. The induction rate is also increasing overall in many countries [7,8] going, for example, from 9% to 21% in the United States between 1989-2004 and from 25% to 29% in Australia between 1998-2007. In 2003, the European trigger rate was quite variable, ranging from 10% in Sweden or Denmark, to 32% in Belgium or Northern Ireland [9]. This is probably due to a different trigger policy between these countries. In Africa, the rate of artificial induction of labor was 2.49% in 2001 in Bamako [10] and 2.31% between 1994-1995 in Abidjan [11]. In Pakistan, it was 15% in 2008 [12].
Patients and Method
This study was conducted at the Nevers Hospital Center, the only level 2B hospital in the department of Nièvre in France. This is a cross-sectional prospective study on the indications, methods and results of labor induction during the period from January 1 to 30 June 2020 (six months). The target population was made up of all the pregnant women who came to consult and whose situations were eligible for an artificial induction of labor. Included was any pregnant woman carrying a pregnancy of more than 28 weeks with an indication of artificial induction of labor. Not included was any pregnant woman carrying a pregnancy of less than 28 WA or presenting no indication of induction or not having expressed verbal or written consent. Data collection was carried out using hospital patient registers, patient medical records and electronic data. A collection sheet has been developed for this purpose.
The data processing was done in several stages:
• Manual counting of the questionnaires;
• Seizure; purification and encoding on Excel 2013;
• The analysis was performed on SPSS version 24; the presentation of the data was done in the form of tables and figures. The descriptive analyzes carried out are the mean and the standard deviation for the quantitative data with a Gaussian distribution and the median with the interquartile space (IQS), for the data with a non-Gaussian distribution, the relative (%) and absolute (n ) for categorical or qualitative data.
Pearson's chi-square test or Fisher's exact test was performed to compare the percentages. Student's t test compared the means. Determinants of induction failure were identified by logistic regression. The association between each factor tested and mortality was estimated using the odds ratio (OR) and its 95% confidence interval. For all the tests used, the significance level was set at 5%.
Results
1. Frequency of induction of labor
During the period of this study, we recorded a total of 563 deliveries in the Gynecology-Obstetrics Department of which 446 vaginally (78.3%) and 127 by caesarean section (21.7%), which 76.4% was planned and 23.6% induction failure: Among these deliveries, 138 were initiated, which represents a frequency by 24.5%.
2. Sociodemographic data of the study population
2.1. Participant ages
|
Table 1: Distribution of participants according to age groups. |
|
|
Variables |
|
|
Age (ans) : X±ET
<30 ans 30 à 44 ans >44 ans |
30.9±5.8 n(%) 45(32.6) 92(66.7) 1(0.7) |
|
The mean age of the study population was 30.9 years with a standard deviation of 6 years. Most were between 30 and 44 years old, or 66.7% of cases. |
|
3. Participants' clinical data
3.1. Gynecological identity of participants
|
Table 2: Distribution of participants according to their gynecological identity. |
|
|
Variables |
n(%) |
|
Parity Primiparous Multiparous Gravida Primigravida Multigravida |
44(31.9) 94(68.1)
37(26.8) 101(73.2) |
|
It emerges from this table that the majority of participants were multiparous (68.1%) and the proportion of multigravida was 73.2%. |
|
3.2. Gestational age
This figure shows that almost all inductions were performed on full-term pregnancies, 132 or 95% of cases.
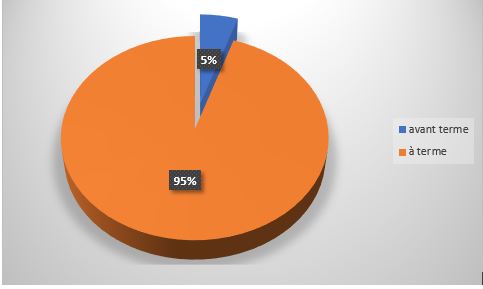
Figure 1: Distribution of participants according to their gestational age.
3.3. State of the uterus
Of the 138 women in whom induction had been performed, 126 or 91% had a healthy uterus and 12 women or 9% had a scar in their uterus.
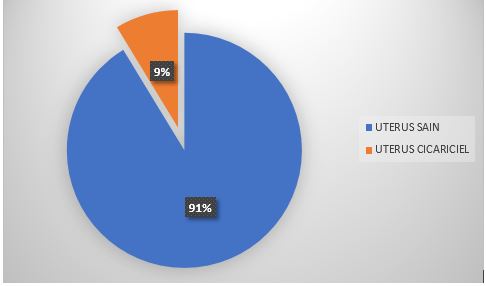
Figure 2: Distribution of participants by condition of the uterus.
3.4. Trigger indications
3.4.1. Indication types
Of the 138 initiations carried out during this study, 131 or 95% were for medical indications and 7 or 5% for convenience.
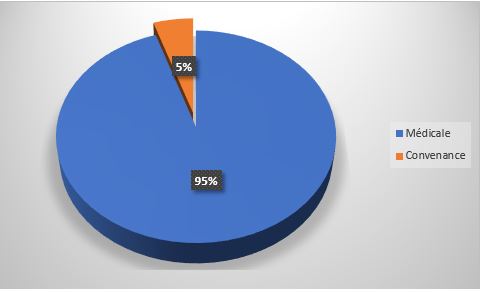
Figure 3: Distribution of participants according to the types of trigger indications.
3.4.2. The main medical indications
|
Table 3: Breakdown of participants according to main medical indications. |
|
|
Variables |
n=131 |
|
Premature rupture of membranes Post-term /prolonged pregnancy Gestational diabetes Preeclampsia IUGR FHRA High blood pressure Twin pregnancy Low volume of amniotic fluide Macrosomia Uterus with scar Cholestasis of pregnancy Others |
35 (26,6) 27 (19,9) 26 (19,1) 12 (9,2) 6 (4,6) 4 (3,1) 4 (3,1) 3 (2,3) 3 (2,3) 2 (1,5) 2 (1,5) 3 (2,3) 5 (4,5) |
|
This table shows us that most inductions were indicated for PROM, post term/prolonged pregnancy, gestational diabetes and severe pre-eclampsia in 26.6% respectively 19.9%, 19.1% and 12.2%. |
|
3.5. Bishop's score
This figure shows that in almost all triggered women, the bishop was less than or equal to 6.

Figure 4: Distribution of participants according to Bishop score.
4. Methods used
|
Table 4: Distribution of participants according to the methods used. |
|
|
Variables |
n(%) |
|
Induction with maturation Detachement Propess Balloon Amniotomy Induction without maturation Ocytocin Maturation +ocytocin |
23(16.7) 59(42.8) 6(4.3) 8(5.8)
42(30.4) 121(87.7) |
It appears from this table that the most used triggering techniques were the use of propess (42.8%) as well as oxytocin (30%) followed by detachment (16.7%). 87.7% of pregnant benefited from the induction by cervical ripening followed by oxytocin and 12.7% did not need oxytocin after ripening.
4.1. Time elapsed between induction and delivery
|
Table 5: Distribution of participants according to the time elapsed between induction and delivery. |
||
|
Time between induction and delivery (hours) |
n=138 |
% |
|
<8 hours |
55 |
39,9 |
|
8-24 hours |
49 |
35,5 |
|
>24 hours |
34 |
24,6 |
It emerges from this table that the median time elapsed between induction and delivery was 9 hours (EIQ: 5-25 hours). In most of the induced women, delivery had taken place before 8 clock (39.9%, 35.5 between 8-24 and 24.6% after 24 clock obstetric identity combined),
4.2. Outcome of the trigger
|
Table 6: Distribution of participants according to the outcome of the trigger. |
|
|
Variables |
n(%) |
|
Vaginal birth Without instrument With instrument C-section birth Failure of the induction FHRA Disproportion Breech birth |
108(78.3) 94(68.1) 14(10.1) 30(21.7) 8(5.8) 21(15.4) 1(0.7) 1(0.7) |
This table highlights that almost all inductions resulted in vaginal delivery (78.3%) and caesarean section was indicated in 21.7% of cases, the main indication of which was Fetal Heart Rate Abnormalities (FHRA) in 15% of cases. case. It should be noted that of the 4 pregnant women triggered for FHRA there were 3 caesarean sections.
|
Table 7: Distribution of participants according to induction outcome and delivery route. |
||||
|
Uterus |
|
Results |
Pvalue |
|
|
Vaginal birth |
C-section |
|||
|
Uterus without scar Uterus with scar |
126 12 |
101(80.2) 7(58.3) |
25(19.8) 5(41.7) |
0.055 |
This table shows us that 12 scarred uterus triggered 58.3% gave birth vaginally and 41.7% by caesarean section. Most caesarean sections were performed on healthy uterus 25 pregnant Vs 5 pregnant
4.3. Fetal outcome
|
Table 8: Distribution of participants according to the Apgar of newborns. |
|
|
Variables |
n (%) |
|
Apgar score <7 ≥7 Transfert in neonatology Yes No |
8(5.8%) 130(94.2%)
6(4.3) 132(95.7) |
This table highlights that 94.2% of children had an Apgar greater than 6, and 4.3% an Apgar less than 6, but among them 6 or 4.3% were transferred to the Neonatology unit.
5. Determining Factors of Induction Failure
5.1. Participant Profile and Trigger Outcome
|
Table 9: Distribution according to the outcome of the triggering and the general profile of the participants. |
||||
|
Variables |
n=138 |
Results of the induction of labor |
p-value |
|
|
Vaginal birth n=108 |
C-section n=30 |
|||
|
Age ≤30 ans >30 ans Parity Primiparous Multiparous Gesture Primigest Multigravida |
52(37.7) 86(62.3)
44(31.9) 94(68.1)
37(26.8) 101(73.2) |
42(38.9) 66(61.1)
39(36.1) 69(63.9)
27(25) 81(75) |
10(33.3) 20(66.7)
5(16.7) 25(83.3)
10(33.3) 20(66.7) |
0.364
0.203
0.101 |
This table shows us that failure to induce labor was observed more in women over 30 years of age (66.7%), with multiparous (83.3%) and multigravida (66.7%) status, but the differences were not statistically significant in both groups.
5.2. Participant Clinical Data and Trigger Outcome
|
Table 10: Distribution by Induction Outcome and Participant Clinical Information. |
||||
|
Variables |
n=138 |
Results of the induction of labor |
p-value |
|
|
Vaginal birth n=108 |
C-section n=30 |
|||
|
Uterus With scar Without scar
Term of pregnancy before term Term Bishop score ≤6 >6
Technique of induction of labor Detachment Proper Balloon Amniotomy Oxytocin
Time elapsed < 9 heures ≥9 heures |
15(10.9) 123(89.1)
7(5.1) 131(94.9)
106(76.8) 32(23.2)
23(16.7) 59(42.8) 6(4.3) 8(5.8) 121(87.7)
65(47.1) 73(52.9) |
12(11.1) 96(88.9)
5(4.6) 103(95.4)
82(75.9) 26(24.1)
15(15) 44(44) 5(5) 3 (3) 89 (89)
53(49) 55(50.9) |
3(10) 27(90)
2(6.7) 28(93.3)
24(80) 6(20)
8 (21.1) 15 (39.5) 1 (2.6) 5 (13.2) 32 (84.2)
12(40) 18(60) |
0.079
0.950
0.714
0.394 0.631 0.542 0.023 0.444
0.049 |
It emerges from this table that induction failure was significantly found in women with whom the time elapsed between induction and childbirth was more than 9 hours (60% p=0.049), benefiting from amniotomy (13.2% p=0.023).
5.3. Determinants of failed induction of labor
|
Table 11: Determinants of failed induction of labor. |
||||
|
Determinants |
Univariate analysis |
Multivariate analysis |
||
|
P |
OR (IC95%) |
P |
ORa (IC95%) |
|
|
Amniotomy Time elapsed ≥9 heures |
0.023
0.049 |
4.9(1.1-21.6)
1.3(1-2.8) |
0.362
0.029 |
1.9(0.8-4.9)
2.6(1.5-4.7) |
In univariate analysis, the determinants of failed induction of labor were early amniotomy and a time elapsed between induction and delivery of more than 9 hours. In multivariate analysis, the strength of association observed in univariate only persisted for a time elapsed between induction and delivery of more than 9 hours [ORa: 2.6 95% CI (1.5-4.7) p=0.029].
Discussion
1. Frequency of induction of labor
During the period of this study, we recorded 138 cases of artificial induction of labor, i.e. a frequency of 24.5% out of a total number of 563 deliveries at the Gynecology-Obstetrics Department of CHAN. This frequency is far higher than that found by Mariam DOLO (Bamako 2010), who reported 160/8699 inductions of labor, i.e. a frequency of 1.84% [34]. Adama Coulibaly (Mali 2019), in his study records 102 cases of artificial induction of labor as well as Kouam and Coll [35], who note 9.82% at the maternity hospital of Yaoundé University Hospital in Cameroon.
Indeed, the frequency of onset is very variable from one region to another and even from one health establishment to another [36-40]. Despite this notion of significant disparity, the trigger rate is generally higher in European countries than in the least developed countries. In 2004 the frequency of induction was 22.1% in the United States and 19.3% in 2003 in France according to the French national survey. This difference between European countries and developing countries in terms of induction of labor could be explained by the large number of inductions for personal convenience carried out in these countries. For example, in France, the frequency of inductions for medical indication has remained stable, while the frequency of indications for convenience has increased over time [41].
2. Sociodemographic data of the study population
2.1. Participant ages
This study found a mean age of 30.9 years with a standard deviation of 6 years. Most were between 30 and 44 years old, or 66.7% of cases. The almost similar results are reported in several series in the literature, including:
• Julia Blanchot (France 2011), in her study, notes an average maternal age of 32.3±5.4 years [42].
• Mariam DOLO (Bamako 2010), finds that the women concerned were aged between 20-34 years (50.61%) with an average of 27 years (Extremes: 16 and 43 years) [34].
• Adama Coulibaly (Mali 2019), reports the age group of 28 to 32 years (56.86%) with an average of 27 years and the extremes of 18 to 38 years [43].
Indeed, the high representativeness of maternal age around the thirties is also supported in several other publications, Sangaré M. [44] and de DOLO M [34] who find 50.61% for the age group of 20 -34 years old; Minebois for the age below 30 years: which seems completely normal, because this age group corresponds to the period of full genital activity of the woman.
3. Participants' clinical data
In the present study, the majority of participants were multiparous (68.1%) and the proportion of multigravid was 73.2%. This observation is similar to that of Mariam DOLO (Bamako 2010), who finds multiparous and pauciparous with respectively 32% and 29% [34]. On the other hand, SANGARE M. [44] observed more of a high proportion of pauciparous and nulliparous during his study at the Point G University Hospital in Bamako, Mali. Likewise Julia Blanchot (France 2011), who reports more primiparous than multiparous (118 vs 86) [42]; Hellene Minbois in her study reported nullipara at 34% and multipara at 18% [45]. Laughon SK et al., showed that the position and consistency of the cervix did not influence the prediction of the success of induction by oxytocinamniotomy [46] whereas parity would intervene considerably in the chances of successful induction. [47]. Indeed, the authors think parity seems to have an important influence on the future of childbirth in the induction policy. This is the case with Parry E and Coll [48], who confirmed this during a retrospective study on the induction of labor in the past term. We also noted that almost all inductions were performed on full-term pregnancies, i.e. 95% of cases. Just like Julia Blanchot (France 2011), who reports an average gestational age of 40 weeks of amenorrhea [42].
3.1. Trigger indications
Of the 138 inductions carried out during this study, 131 or 95% were for medical indications and 7 or 5% for convenience. Among the medical indications, PROM came first with 26.6% followed by overterm/prolonged pregnancy, gestational diabetes and severe preeclampsia with respectively 19.9%, 19.1% and 9.2%. those of other authors, in particular, Julia Blanchot (France 2011), who finds prolonged pregnancies (32.6%) and premature rupture of membranes (22.5%) as indications [42]. Minebois in France 2017 find RPM at 16.2% followed by PES at 10.5% As does Mariam DOLO (Bamako 2010), and who notes in her study, the overrun of term in most patents [45]. And Adama Coulibaly (Mali 2019), who also reports premature rupture of membranes with 40.2% [43]. Indeed, these same indications are also reported in the literature [48-53]. This study also noted that in almost all triggered women, the bishop was less than or equal to 6. This observation is consistent with that of Julia Blanchot (France 2011), who notes in her study an average Bishop score of 4, 3 ± 2.2, which is significantly higher in the event of convenience induction than during medical indication induction: respectively 6.5 ± 1.3 versus 3.9 ± 2.1 (p < 0.01) [42].
4. Methods used and time elapsed between induction and delivery
In the present study, the most used induction techniques were the use of propess (42.8%) followed by oxytocin (30%) and detachment (16.7%). (87.7%) of pregnant women benefited from induction by maturation plus oxytocin and 12% from cervical maturation without oxytocin. The median time elapsed between induction and delivery was 9 hours (IQS: 5-25 hours). In most induced women, delivery took place 18 hours later (32.6%). These observations go in the same direction as that of Julia Blanchot (France 2011), who notes in her study an average duration of 5.5 ± 2.8 hours but in line with the study of Minebois in France in which the balloon was the most used method 35.2% and properess 28.6% [42].
5. Outcome of the trigger
This study noted that almost all inductions were sanctioned by vaginal delivery (78.3%) and cesarean section was indicated in 21.7% of cases. The main indication was ARCF in 13% of cases. Similar results are also reported by Julia Blanchot (France 2011), who finds in her study that the rate of spontaneous lower tract was 59% in the context of a medical indication trigger against 76.9% in the context of a triggering of convenience [42]. The caesarean section rate was 25.3% in the context of medically indicated induction and 3.8% in the context of convenience induction. Likewise Mariam DOLO (Bamako 2010), who reports in her study that of the 160 pregnant women admitted for induction, 158 gave birth vaginally. The failure rate was 1.23% [34]. Adama Coulibaly (Mali 2019), Out of 102 pregnant women admitted for induction, we recorded 94 vaginal passages and 8 cesarean sections [43]. The failure rate was therefore 7.84%; in his study Minebois in 2016 reports 105 cases of induction with 90.5% success, 72% vaginal delivery 9% cesarean delivery [45].
6. Fetal outcome
This series noted that the majority of children had an Apgar greater than 6, except eight children, of whom 6 or 4.3% were transferred to the Neonatology unit. Just like Mariam DOLO (Bamako 2010), who recorded no maternal or fetal deaths [34]. Nasreen Abbasi et al [53] reported that live neonates were generally well with an Apgar greater than or equal to 7 out of 10 at the first minute in 88.75%, which is the expected result when an indication is given. Trigger. This result is comparable to that of Diallo D. [54] who found 74.6% with an Apgar score greater than 7. i.e. 32.8%. The follow-up to neonatology care was simple. Our referral rate in neonatology is due to the protocol of the service indicating to address all indications of artificial induction of labor to CHAN pediatricians for a thorough evaluation of the newborn.
7. Determinants of failed induction of labor
This study noted as determinants of failure to induce labor: early amniotomy and a time elapsed between induction and delivery of more than 9 hours, i.e. a risk multiplied by 3 [ORa: 2.6 95% CI (1.5-4.7) p=0.029]. This is also confirmed in several series in the literature, which say that the longer the delay, the higher the failure rate (32, 33, 34). Of 8 pregnant women who had early amniotomy we had 5 failures, of 4 pregnant women triggered for ARCF we had 3 failures, and all with a delay of more than 24 hours The leading cause of caesareans was ARCF/p>
Conclusion
In our structure, almost all of the inductions were sanctioned by a vaginal delivery. Nevertheless, there are a few cases of failure having mainly as determinants early amniotomy on an unfavorable Bishop Score and a time elapsed between induction and delivery of more than 9 hours. Hence the need to clearly state the indication, to respect the conditions, to adopt a corresponding method and to ensure close follow-up in order to avoid any complications that could lead to failure.
References
1. BENRUBI G. 2000. Labor induction: historic perspectives. Clinical obstetrics and gynecology, 43: 429-432. Ref.: https://pubmed.ncbi.nlm.nih.gov/10949746/ DOI: https://doi.org/10.1097/00003081- 200009000-00002
2. HAS. ANDEM/ANAES : fonds de l’évaluation médicale. 2005.
3. Collège national des gynécologues et obstétriciens français. [Référence du 17 juin 2010], http://www.cngof.asso.fr/. Organisation Mondiale de la Santé.
4. ANAES. 1999. Les recommandations pour la pratique clinique : bases méthodologiques.
5. CNGOF. 1995. Déclenchement artificiel du travail : conférence de consensus.
6. HAS. 2008. Déclenchement artificiel du travail à partir de 37 SA : recommandations professionnelles et argumentaire.
7. CABROL D. 1989. Déclenchement artificiel du travail à terme. France : Upjohn. 71.
8. INSERM. 2005. Enquête nationale périnatale.
9. SCHOTT K. 2008. Early postpartum hemorrhage after induction of labor. Journal of midwifery and women’s health. 53: 461-466. Ref.: https://pubmed.ncbi.nlm.nih.gov/18761300/ DOI: https://doi.org/10.1016/j.jmwh.2008.01.008
10. Ricbourg A. 2012. Techniques de déclenchement artificiel du travail. In: Tournaire M. Mises à jour en gynécologie- obstétrique Paris, CNGOFVigot. 165.
11. Cunningham Fg, Leveno Kj, Bloom Sl. 2005. Hauth, Jc et Williams. Obstetrics 22ème édition. Etats-Unis : Mc GRAW-HILL. 1441.
12. The Cochrane Database of Systematic Reviews. Membrane sweeping for induction of labour. 2005.
13. Mackenzie I. 2006. Induction of labour at the start of the new millenium. Reproduction. 131: 989- 998. Ref.: https://pubmed.ncbi.nlm.nih.gov/16735538/ DOI: https://doi.org/10.1530/rep.1.00709
14. Schmitz T, Goffinet F. 2006. Contre l'utilisation du misoprostol dans le déclenchement du travail à terme en routine. Gynécologie obstétrique et fertilité. 34: 161-165.
15. Reduction of cesareans by nitric oxide (NO) donors in post term pregnancies. [Référence du 20 janvier 2011]. http://clinicaltrials.gov/ct2/show/NCT00930618
16. The Cochrane database of systematic reviews. Homeopathy for induction of labour. 2003.
17. The Cochrane Database Of Systematic Reviews. Acupuncture for induction of labour. 2003.
18. Jacques Lansac, Philippe Descamps, Francois Goffinet. Pratique de l’accouchement. Partie V : Techniques obstétricales, 6ème édition, Elsevier Masson 2016 : chap 28 protocoles en gynécologie Obstétrique.
19. CNGOF, 4ème édition, Elsevier Masson 2018.
20. Robert M, Jean Levy, Jean Melchior. 2003. Précis d'obstétrique 6ème édition, Masson, Paris, 597.
21. Diallo D. 2009. Le déclenchement artificiel du travail d'accouchement : Critères prédictifs de réussite et pronostic materno-fœtale Mémoire DES Gynéco-Obstétrique Bamako.
22. Germain G, Carbonne B, Carol D. 1993. Physiologie de la contraction utérine. Encycl. Med Chir Editions Techniques (Paris France), Obstétrique, 5-049-D, 8.
23. Abirached F, Haddad B, Garnier A. Déclenchement artificiel du travail a terme. In: E Papiernik, D Cabrol, J-C Pons, eds. Obstétrique, Paris: Médecine.
24. Berland M. Physiologie du déclenchement spontané du travail. Encycl. Med Chir Editions Techniques (Paris-France), obstétrique, 5-049-D.
25. Parry E, Parry D, Pattison N. 1998. Induction of labor for post-term pregnancy: an observation study Aust NZ Gynecology. 38: 275-280. Ref.: https://pubmed.ncbi.nlm.nih.gov/9761152/ DOI: https://doi.org/10.1111/j.1479- 828x.1998.tb03065.x
26. Berland M. 1997. Déclenchement artificiel du travail. Encycl. Med Chir (Elsevier, Paris), Obstétrique 5-04-D-28. 12.
27. Goldenberg RL, Culhane JF, Iams JD, 2008. Romero R. Epidemiology and causes of preterm birth. Lancet Lond Engl. 371: 75-84. Ref.: https://pubmed.ncbi.nlm.nih.gov/18177778/ DOI: https://doi.org/10.1016/s0140- 6736(08)60074-4 :
28. Gucciardo L, Toumsin H, Foidart JM. 1998. Les effets de l'induction du travail sur le déroulement de l'accouchement. Revue médicale de Liège. 53: 665-668. Ref.: https://pubmed.ncbi.nlm.nih.gov/9887658/
29. Kouam L, Kamdoum MJ, Shasha W, 1993. Le travail induit : conditions de succès et causes d'échec, une étude prospective de 162 cas. Revue Fr Gynecol Obstet. 88: 243-248. Ref.: https://pubmed.ncbi.nlm.nih.gov/8502895/
30. Pambou O, Iloki HL, Ekoundzola, JR, et al. 1998. Le misoprostol (CYTOTEC) en pratique obstétricale au 3e trimestre de la grossesse à Brazzaville. Etude préliminaire sur 87 cas. Vème congres de la société africaine de gynécologie et d'obstétrique (SAGO). 14-18.
31. Droulez R, Girard A, Dumas B, et al. 2008. Prédiction de la réussite du declenchement du travail. Comparaison entre le score de Bishop et le dosage de la fibronectine foetale. Journal de Gynéco-Obstétrique et biologie de la réproduction. 37: 691-676.
32. Blondel B, Lelong N, Kermarrec M, et al. 2012. National Coordination Group of the National Perinatal Surveys. Trends in perinatal health in France from 1995 to 2010. Results from the 26- French National Perinatal Surveys. J Gynecol Obstet Biol Reprod (Paris). 41: 1-15.
33. Mamelle N, Vendittelli F, Rivière O, et al. 2004. [Prenatal health in 2002-2003. Survey of medical practice. Results from the Audipog sentinel network]. Gynecol Obstet Fertil. 32: 4-22.
34. Carbonne B. 1999. [Indications and circumstances of labor induction in the case of premature rupture of the membranes]. J Gynecol Obstet Biol Reprod (Paris). 28: 683-686.
35. Pottecher T, Luton D, Zupan V, et al. 2009. [Multidisciplinary management of severe preeclampsia]. J Gynecol Obstet Biol Reprod (Paris). 38: 351-357.
36. American College of Obstetricians and Gynecologists. ACOG Practice bulletin no. 2013 Fetal growth restriction. Obstet Gynecol. 121: 1122-1133.
37. Poissonnier MH. 2000. [Fetomaternal blood immunization. Screening, prevention]. Rev Prat. 50: 1029-1034.
38. Royal College of Obstetricians & Gynaecologists. Obstetric Cholestasis (Green-top Guideline No. 43. Royal College of Obstetricians & Gynaecologists.
39. Alfirevic Z, Aflaifel N, Weeks A. 2014. Oral misoprostol XE "Misoprostol for induction of labour. Cochrane Database yst Rev. 6: CD001338.
40. Bel S, et al. 2014. Enquète sur les méthodes de maturation cervicale en France.Gynecol Obstet Fertil. 42: 301-305. Ref.: https://pubmed.ncbi.nlm.nih.gov/24411337/ DOI: https://doi.org/10.1016/j.gyobfe.2013.11.002
41. Berkane N, et al. 2005. Use of mifepristone to ripen the cervix and induce labor interm pregnancies, Am J Obstetrique Gynecology. 192: 114-120. Ref.: https://pubmed.ncbi.nlm.nih.gov/15672012/ DOI: https://doi.org/10.1016/j.ajog.2004.05.084
42. Beucher G, et al. 2014. Obtention de la vacuité utérine dans le cadre d’une perte de grossesse. J Gynecology Obstetrical Biol Reprod. 43: 794- 811. Ref.: https://pubmed.ncbi.nlm.nih.gov/25447362/ DOI: https://doi.org/10.1016/j.jgyn.2014.09.013
43. French College of Gynecologists and Obstetricians. 2013. [Intra-uterine growth retardation: guidelines for clinical practice--Short text]. J Gynecol Obstet Biol Reprod (Paris). Déc. 42: 1018-1025.
44. Blondel B. 2003. Enquéte nationale périnatale 2010:les naissances en 2010 et leur évolution depuis 2003. 2011.
45. American College of Obstetricians and Gynecologists. 2016. Committee on Practice Bulletins—Obstetrics. Practice Bulletin No. 172: Premature Rupture of Membranes. Obstet Gynecol. 128: 165-177.
46. Bond DM, Middleton P, Levett KM, et al. 2017. Planned early birth versus expectant management for women with preterm prelabour rupture of membranes prior to 37 weeks’ gestation for improving pregnancy outcome. Cochrane Database Syst Rev. 3: CD004735.
47. Arlicot C, Le Louarn A, Bacq Y, et al. 2012. [Management of obstetric cholestasis in France: A national survey of obstetrical practice]. J Gynecol Obstet Biol Reprod (Paris). 41: 182-193.
48. Boulvain M, Stan C, Irion O. 2005. Membraneszeeping for inuction of Labour. Cochrane Database system Rev. 1: CD000451. Ref.: https://pubmed.ncbi.nlm.nih.gov/15674873/ DOI: https://doi.org/10.1002/14651858.cd000451.pub2
49. Deruelle P, et al. 2012. Mode de declenchement du travail et conduite du travail en cas d'utërus cicatriciel. J Gynecol Obstet Biol Reprod. 41: 788-802. Ref.: https://pubmed.ncbi.nlm.nih.gov/23142358/ DOI: https://doi.org/10.1016/j.jgyn.2012.09.030
50. Dodd JM, Crowther CA. 2010. Misoprostol for induction of labour to terminate pregnancy in the second or third trimester for women with fetal anomaly or after intrauterine fetal death. Cochrane Database Syst Rev. 4: CDO04901.
51. Ghassani A, et al. 2014. Declenchement du travail des grossesses gémellaires XE Grossesse gemmelaire : Comparaison avec les grossesses monofoetale et facteurs asociés aux risque d’échec. J Gynecol obstet Biol Reprod. 44: 237- 245.
52. Goffinet F, et al. 2003. Enquete des pratiques de maturation du col et de déclenchement du traval en France. J Gynecol Obstet Biol de reprod. 32: 638-646. Ref.: https://pubmed.ncbi.nlm.nih.gov/14699333/
53. Hélène Minebois. 2017. Déclenchement du travail avant 37 semaines d’aménorrhée : évaluation des pratiques au CHRU de Nancy. Sciences du Vivant [q-bio]. hal-01932236.
54. Adama M. Déclenchement artificiel du travail d’accouchement : utilisation du misoprostol (pronostic maternel et foetal) au centre de sante de reference de la commune i du district de bamako Thèse Présentée et soutenue publiquement le 16/10/2019 devant la Faculté de Médecine et d’Odonto-Stomatologie de Bamako.