
-
Mail us:
editor@raftpubs.org
Indexing & Abstracting
Full Text
Research ArticleDOI Number : 10.36811/jcri.2019.110003Article Views : 3137Article Downloads : 33
Biological Treatment of a Synthetic Musk in a Raw Hospital Wastewater Under Different Sludge Retention Times
Gokce Guney1 and Delia Teresa Sponza2*
1Dokuz Eylul University Engineering Faculty Environmental Engineering Department, Tinaztepe Campus, 35160, Buca, Izmir, Turkey
2PDokuz Eylul University Engineering Faculty Environmental Engineering Department, Tinaztepe Campus, 35160, Buca, Izmir, Turkey
*Corresponding author: Delia Teresa Sponza, Dokuz Eylul University Engineering Faculty Environmental Engineering Department, Tinaztepe Campus, 35160, Buca, Izmir, Turkey, Email: delya.sponza@deu.edu.tr
Article Information
Aritcle Type: Research Article
Citation: Gokce G, Delia Teresa S. 2019. Biological Treatment of a Synthetic Musk in a Raw Hospital Wastewater Under Different Sludge Retention Times. J Case Rept Img. 1: 15-26.
Copyright:This is an open-access article distributed under the terms of the Creative Commons Attribution License, which permits unrestricted use, distribution, and reproduction in any medium, provided the original author and source are credited. Copyright © 2019; Gokce G
Publication history:
Received date: 19 December, 2018Accepted date: 18 January, 2019
Published date: 19 January, 2019
Abstract:
Pharmaceuticals and personal care products (PPCPs) are the problem of our age and hospital wastewaters are one of the main sources of PPCPs having a concentration range of ng L-1 to µg L-1 Hospital wastewaters are almost untreated before being discharged into municipal/urban wastewater treatment plants (WWTPs) via wastewater networks in Turkey. These WWTPs are not designed to remove complex compounds such as PPCPs, however, a sizeable amount is released into the environment. Some of the PPCPs present a considerable threat for aquatic organisms even at very low concentrations. This study presents the biological treatability of a synthetic musk namely musk tonalide (AHMT) from a raw hospital wastewater under different sludge retention times (SRTs). The treatability of this PPCP was investigated using an anaerobic UASB/aerobic CSTR sequential biological reactor system in laboratory conditions for the first time in Turkey. Effect of different sludge retention times (5; 30; 45 and 55 days) on the removal of AHMT was researched at mesophilic temperature conditions for the biological reactors. COD, SCOD and AHMT yields were determined. Methane gas (CH4) productions and VFA concentrations were also monitored in anaerobic UASB reactor. pH changes, dissolved oxygen (DO) variations and redox potentials (ORPs) were monitored in anaerobic UASB and aerobic CSTR reactors. As a result of the study, increasing of the SRT has a positive effect on COD (94.1%) and SCOD (91.1%) yields at 55 days of SRT in the biological reactor system. Also, biodegradation (in the supernatant) and adsorption (onto biological sludge) removal efficiencies of AHMT were increased at higher SRTs. AHMT was removed 42.3% with biodegradation from the supernatant while adsorption removal efficiency reached 57.5% in the biological sludge at 55 days of SRT for the anaerobic UASB/aerobic CSTR sequential biological reactor system.
Keywords: Biological treatment; Musk tonalide; Raw hospital wastewater; Sludge retention time
Introduction
Micropollutants such as pharmaceuticals and personal care products (PPCPs) in hospital wastewater are directly discharged into the sewage system without treatment since the conventional sewage/urban treatment plants can only remove macropollutants such as BOD5, COD, heavy metals, nitrogen and phosphorus in Turkey. The micropollutants decrease the biological treatment efficiency if they are not treated and then discharged into the receiving environment [1]. AHMT is a pharmaceutical and personal care product (PPCP) and used as a synthetic musk. Synthetic musks are a group of persistent organic chemicals that have been used as fragrances in household products, perfumes and other cosmetic products. Since then many studies have dealt with the environmental distribution of these chemicals and today such compounds have been proven to be present in practically all environmental compartments, including human tissue, close to densely populated areas [2]. Even low concentrations of these musk compounds have been reported to inhibit multixenobiotic resistance mechanisms in mussels, to cause cell type-dependent anti-estrogenic effects and to inhibit larval development in marine copepods [3]. The recent studies performed with AHMT contained mostly the detection of its levels in water, sediment [4,5] and the detection methods [6,7] of AHMT. The treatability studies of AHMT is limited with some studies: Santiago-Morales et al. [8], investigated the treatment of AHMT with ozonation with hydrogen peroxide (O3, O3/H2O2), ultraviolet (254 nm low pressure mercury lamp) and xenon-arc visible light irradiation. The best results was 65% removal after 5 min with ozonation and light photocatalytic ozonation (O3/Xe/Ce-TiO2). A significant removal of 79% was obtained for AHMT after 15 min during visible light photocatalysis (O2/Xe/Ce-TiO2). An anaerobic membrane reactor was used to remova tonalide from the aqueous phase of a pharmacy wastewater by a combination of biotransformation and sorption onto the biosolids [9]. Biotransformation of tonalide was observed to be the dominant removal mechanism (87%). Zhang et al., [10], found that the adsorption of AHMT to microplastics is low (34%) while the equilibrium sorption time was about 10 h and the adsorption kinetics model conformed to a Lagergren adsorption mode at 25°C.
The novelty of the study is to treat a synthetic musk namely musk tonalide (AHMT) biologically from a raw hospital wastewater under different sludge retention times (SRTs) for the first time in Turkey.
The aim of this study was to evaluate the treatability of this PPCP using an anaerobic UASB/aerobic CSTR sequential biological reactor system in laboratory conditions. Effect of different sludge retention times (5, 30, 45 and 55 days) on the removal of AHMT was researched at mesophilic temperature conditions for the biological reactors. COD, SCOD and AHMT removal efficiencies were determined. Methane gas (CH4) productions and total volatile fatty acid (TVFA) concentrations were also monitored in anaerobic UASB reactor. Also, dissolved oxygen (DO) variations and redox potentials (ORPs) were monitored in anaerobic UASB and aerobic CSTR reactors.
Materials and Methods
Source and Characterization of Raw Hospital Wastewater and Biomass
Raw hospital wastewater was taken from Dokuz Eylul University Hospital (Izmir, Turkey) sewer channel. The influent chemical oxygen demand (COD) concentration of the raw hospital wastewater was 912±43 mg L-1 while the influent soluble chemical oxygen demand (SCOD) concentration of the raw hospital wastewater was 822±28 mg L-1 (Data not shown). The influent musk tonalide (AHMT) concentration was 236.00±0.05 µg L-1 (Data not shown). The pH, the temperature, the total nitrogen and total phosphorus concentrations were 8.50±0.02, 18±2°C, 0.40±0.01 and 1.00±0.01 mg L-1, respectively (Data not shown). Anaerobic and aerobic biomass were taken from Pakmaya Baker’s Yeast Factory’s (Izmir, Turkey) anaerobic reactor and aeration tank of the biological treatment process, respectively.
Physicochemical Properties of AHMT
The physicochemical properties of micropollutants are important in the prediction of their environmental fate and in the development of analytical detection methods. Based on the calculated log Kow value reported for AHMT, it can be said that AHMT is very hydrophobic. Physicochemical properties of AHMT are given in Table 1.
| IUPAC name | Abbreviation | Molecular weight(gr mol-1) | Chemical formula | Solubility in water, at 25°C (gL-1) | Octanol/water partition coefficient, log Kow | Molecular structure |
| Musk Tonalide 6-Acetyl-1,1,2,4,4,7-hexamethyl-tetralin(CAS No: 21145-77-7) | AHMT | 258.40 | C18H26O | 1.25×10⁻³ | 5.70 |
 |
Reactor Configurations of the Anaerobic/Aerobic Sequential Reactor System
The laboratory-scale aerobic reactor used in this system consists of a continuous flow stirred tank reactor (CSTR) without sludge return and has a total volume of 2.0 L (Figure 1). The anaerobic reactor is an upflow anaerobic sludge bed reactor (UASB) without sludge return and has a total volume of 2.5 L (Figure 1). They were equipped with influent, effluent, sampling and gas outlet valves. Required temperature conditions for the both reactors were provided with infrared heaters. Sequential reactor was defined as the total of anaerobic and aerobic reactor.
Operational Conditions Used in this Study
All the biological reactors were fed with synthetic hospital wastewater for 20 days. After the start-up period, the reactors were filled with raw hospital wastewater for 20 days for each SRT and the effects of SRTs (5, 30, 45 and 55 days) on COD, SCOD, AHMT yields in aerobic and in anaerobic reactors were determined while methane gas productions, TVFA accumulation and the ratio of TVFA to bicarbonate alkalinity were monitored in the anaerobic reactor. Since the sludge was not recycled; the sludge retention time was equal to hydraulic retention time. The SRT was adjusted by discarding of certain amount of sludge by using a formula of SRT=V/Qw in both reactors. V; is the reactor volume while Qw is the wasted sludge according to SRT chosen. The anaerobic and aerobic reactors were operated 20 days during each SRT to reach steady-state conditions. The steady-state conditions were defined with constant effluent pollutant concentrations during 7 executive days.
Figure 1: Laboratory scale Anaerobic/Aerobic Sequential Reactor System.

Analytical Procedure for AHMT Measurement in the Raw Hospital Wastewater
Analysis were performed in a gas chromatograph coupled to a quadrupole mass spectrometer, in electron ionization (EI) mode, using a GC-MS (Agilent 7890A) combined with a mass selective detector (Agilent 5975C inert MSD) equipped with a flame ionization detector and an HP-5MS capillary column with a length of 30.0m×0.25mm (I.D.)×0.25μm (film thickness) (Agilent Technologies Inc.). Helium (purity 99.999%) was employed as carrier gas with a constant flow of 1.0 mL min-1. The standards were injected (2µL) into the GC system in splitless mode, with a splitless time of 1.5 min. The injector, quadrupole, transfer line and ion source were set at 275, 150, 300 and 230°C respectively. The oven program was set at 35 °C for 0 min then 5°C min-1 to 200°C for 0 min then to 20°C min-1 to 285 °C for 5 min. Acquisition was performed by Selected Ion Monitoring (SIM) and the monitored ions were 243 and 258 m/z for AHMT. The retention time was determined as 30.891 min [12]. Aqueous AHMT stock solution was prepared from the AHMT standard (Fluka, 6-Acetyl-1,1,2,4,4,7-hexamethyl-tetralin). Calibration curve of AHMT was drawn for 1-5-10-50-100-200 µg L-1. Correlation coefficient (R2) was obtained as 0.997567 for AHMT. AHMT were extracted from raw hospital wastewater by solid-phase extraction (SPE) method. The OASIS HLB Cartridge was conditioned with 6 mL of 30% MeOH in DCM followed by the addition of 6 mL MeOH. After passing the sample through the cartridge, the cartridge was dried under vacuum for 1 hour. The compounds were eluted with 6 mL of mixture of DCM-hexane (4:1). The eluant was evaporated using Nitrogen evaporator. The dried extract was then dissolved in hexane and the final volume made to 1 mL [13].
Conventional Pollutants Measurement Methods
COD, SCOD, MLSS and MLVSS were measured according to Standard Methods [14]. Total nitrogen and total phosphorus were measured with reagent kits in a Photometer Nova 60/Spectroquant. pH, DO and ORP were measured with WTW probes. Bicarbonate alkalinity and TVFA were measured using the Anderson and Yang method [15]. CH4 gas productions were detected by using a liquid containing 3% NaOH to scrub out the CO2 from the biogas [16].
Calculation of AHMT Adsorption and Volatilization
To determine the adsorption of the micropollutants onto activated sludge, eluates were prepared from activated sludge samples from aerobic and anaerobic reactors. Granular sodium sulfate was burnt at 450 °C for 2 hours firstly, and then it was desiccatored for 1 hour. The burnt sodium sulfate was added to the activated sludge sample to the dewatering process. Methanol was added to the dewatered sludge samples and the eluate was strirred for 24 hours on magnetic stirrers. The eluate was filtered first 0.45 µm cellulose acetate membrane filter (Sartorius Stedim Biotech) and then filtered through 0.45 µm PVDF membrane filter (Pall Corporation). The eluates were extracted according to the aforementioned SPE method and then, they were measured in GC-MS. For the determination of AHMT volatilization polyurethane foam (PUF) disks were used both for anaerobic and aerobic reactors. PUF disks were placed the headspace of each reactor and the reactors were placed in a closed glass system. At the end of the each SRT operations, PUFs samples were soaked with 1:1 acetone:hexane for 24 hours. Then the PUFs samples were sonicated for 60 min after they were soaked in 1:1 acetone:hexane overnight. Using a rotary evaporator, the 1:1 acetone:hexane mixture was dried. The dried extract volume was increased to 5 mL with adding hexane after then, it was dried completely under a stream of high purity N2. This process was repeated two times. Finally, the dried extract volume was adjusted to 1 mL with hexane.
Mass Balance Calculations for AHMT in Biological Reactors
Mass balance calculations were practiced according to the following equations. CW, CA and CS represent concentration in water, air and sludge, respectively. VW, VA and VA represent volume of the water in biological reactor, obtained extract volume from PUF disk for volatilization analysis and obtained extract volume from biological sludge for adsorption test, respectively. m1 and m2 represent dry weight of the sludge in analysis and dry weight of the sludge in biological reactor, respectively. M1 shows the AHMT amount in the supernatant of the biological reactor denominated in µg (Eq. 1). M2 shows the AHMT amount in the sludge of the biological reactor denominated in µg (Eq. 2). M3 shows the AHMT amount in the headspace of the biological reactor denominated in µg (Eq. 3). MT shows the total AHMT amount in the anaerobic/aerobic sequential biological reactor system denominated in µg (Eq. 4).
M1 (µg) = CW (µg/L) × VW (L) (Eq. 1)
M2 (µg) = CA (ng/mL) × VA (mL) × 10-3 (µg/ng) (Eq. 2)
M3 (µg) = [CS (ng/mL) × VS (mL) / m1 (gr)] × m2 (gr) × 10-3 (µg/ng) (Eq. 3)
MT = M1 + M2 + M3 (Eq. 4)
Statistical Analysis
The correlation (R2) between data was performed using Excel Microsoft 2010 while the sensitivity analysis was performed in ANOVA (one-way) tests using an α-value of 0.05.
Results and Discussions
Start-up Period of the Biological Treatment Processes
The anaerobic/aerobic sequential reactor system was operated for 20 days with synthetic wastewater at an SRT of 5 days corresponding to an organic loading rate of 0.18 gr COD/L × day to reach steady-state conditions by providing the acclimation of the anaerobic and aerobic biomass in the reactors (Data not shown). The COD yields were recorded as 90% and 80% in the aerobic and anaerobic reactors, respectively, after the system reached steady state conditions (Data not shown). After this period, the continuous studies with raw hospital wastewater were begun. The MLSS and MLVSS concentrations in the aerobic and anaerobic reactors during the study were shown in Table 2.
| MLSS (mg L-1) | MLVSS (mg L-1) | |||||
| SRT (day) | Aerobic Reactor | Anaerobic Reactor | Sequential Reactor | Aerobic Reactor | Anaerobic Reactor | Sequential Reactor |
| 5 | 3950 | 18000 | 21950 | 3160 | 14400 | 17560 |
| 30 | 4000 | 23900 | 27900 | 3200 | 19120 | 22320 |
| 45 | 4450 | 25650 | 30100 | 3560 | 20520 | 24080 |
| 55 | 4980 | 34500 | 39480 | 3984 | 27600 | 31584 |
| During the anaerobic and aerobic phases, 0 and 2 mg L−1 dissolved oxygen was observed and the redox potential was around −610 and +145 mV, respectively. | ||||||
COD and SCOD Removals in Continuous Operated Biological Reactors
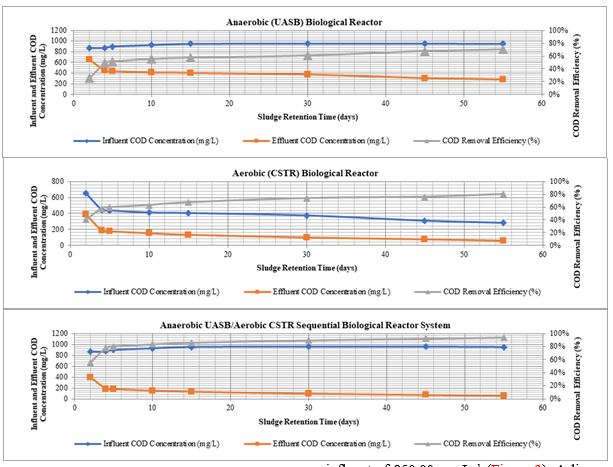
During the 5 days of SRT operation, the maximum COD removal efficiency of the single anaerobic reactor was obtained as 51.3% with a COD effluent of 438.30 mg L−1 at a COD influent of 900.00 mg L−1. For the single aerobic reactor, maximum COD removal efficiency was measured as 59.6% with an effluent COD of 177.07 mg L−1 at a COD influent of 438.30 mg L−1. For the anaerobic/aerobic sequential reactor system, COD removal efficiency reached 80.3% with an effluent of 177.07 mg L−1 at a COD influent of 900.00 mg L−1 (Figure 2). Thereafter, SRT was increased to 30 days. For the anaerobic/aerobic sequential reactor system, COD removal efficiency reached 89.7% with an effluent COD concentration of 98.08 mg L−1 at a COD influent of 955.00 mg L−1 (Figure 2). Thirdly, SRT was increased to 45 days. COD removal efficiency of the anaerobic/aerobic sequential reactor system measured as 92.2% with an effluent COD concentration of 74.03 mg L−1 at a COD influent of 955.00 mg L−1 (Figure 2). Finally, when the SRT was increased to 55 days, COD removal efficiency of the anaerobic/aerobic sequential reactor system reached 94.1% with an effluent COD concentration of 55.68 mg L−1 at a COD influent of 950.00 mg L−1 (Figure 2). A linear correlation between COD yields and SRTs was found for anaerobic/aerobic sequential biological reactor system and this regression is significant (R2=0.96, P=0.006).
The maximum SCOD removal efficiency of the single anaerobic reactor was obtained as 40.4% with a SCOD effluent of 479.78 mg L−1 at a SCOD influent of 805.00 mg L−1 during the 5 days of SRT operation. For the single aerobic reactor, maximum SCOD removal efficiency was measured as 57.3% with an effluent SCOD of 204.87 mg L−1 at a SCOD influent of 479.78 mg L−1. For the anaerobic/aerobic sequential reactor system, SCOD removal efficiency reached 74.6% with an effluent of 204.87 mg L−1 at a SCOD influent of 805.00 mg L−1 (Figure 3). The reactors were operated.
Figure 2: COD concentrations and yields during the 5, 30, 45 and 55 days of SRT operations.
When the SRT was increased to 30 days, for the anaerobic/aerobic sequential reactor system, SCOD removal efficiency reached 84.4% with an effluent SCOD concentration of 132.64 mg L−1 at a SCOD influent of 850.00 mg L−1(Figure 3). SCOD removal efficiency of the anaerobic/aerobic sequential reactor system measured as 88.1% with an effluent SCOD concentration of 100.84 mg L−1 at a SCOD influent of 850.00 mg L−1 for the 45 days of SRT operation (Figure 3). For the 55 days of SRT, SCOD removal efficiency of the anaerobic/aerobic sequential reactor system reached 91.1% with an effluent SCOD concentration of 75.64 mg L−1 at a SCOD influent of 850.00 mg L−1 (Figure 3). A linear correlation between SCOD yields and SRTs was found for anaerobic/aerobic sequential biological reactor system and this regression is significant (R2=0.99, P=0.004).
The high performance in the sequential treatment can be attributed to the anaerobic pre-treatment used in order to biodegrade the already low COD and SCOD content prior to the aerobic stage. Some researchers reported that the removals of COD and soluble COD parameters gradually increased with increasing hydraulic retention time [17-19]. In our study, hydraulic and sludge retention times were equal to each other because of the biological reactors without sludge returns. In our study, although no significant differences in COD and SCOD yields were observed at 30, 45 and 55 days of SRTs, the highest COD and SCOD removal efficiencies were achieved at the longest SRT of 55 days in the sequential system. This could be attributed to the good acclimation of the microorganisms to the hospital wastewater characteristics. The reason for the slight decrease in COD and SCOD yields at the lowest SRT of 5 days is the low contact time of wastewater with sludge granules [20,21].
Figure 3: SCOD concentrations and yields during the 5, 30, 45 and 55 days of SRT operations.

Variation of TVFA in the Anaerobic Reactor of the Sequential Reactor System
The TVFA concentration of the anaerobic reactor of the sequential reactor system reached 180 mg acetic acid L−1 at the end of the 5 days of SRT operation (Table 3). When the SRT was increased to 55 days, the TVFA concentration of the anaerobic reactor of the sequential reactor system decreased to 46 mg acetic acid L−1 (Table 3). Sánchez et al. and Malpei et al. suggested that when the values for TVFA/Alkalinity ratio are lower than 0.3-0.4 the system is under steady-state conditions [22,23]. In this study, TVFA to alkalinity ratios during the experimental studies were 0.12, 0.03, 0.02 and 0.02 at 5, 30, 45 and 55 days of SRT operations, respectively (Table 3).
| Anaerobic Reactor of the Sequential Reactor System | ||||
| SRT (day) | OLR (gr COD/L×d) | TVFA (mg L−1) | Bicarbonate Alkalinity (mg CaCO3 L−1) | TVFA/Alkalinity Ratio |
| 5 | 0.180 | 180 | 1500 | 0.12 |
| 30 | 0.068 | 92 | 3250 | 0.03 |
| 45 | 0.042 | 64 | 3700 | 0.02 |
| 55 | 0.028 | 46 | 2300 | 0.02 |
Methane Gas Variation in the Anaerobic Reactor of the Sequential Reactor System
In this study, average CH4 gas volumes of the anaerobic reactor of the sequential reactor system were determined as 161.6, 203.2, 226.3 and 234.1 mL CH4 day−1 for 5, 30, 45 and 55 days of SRT operations, respectively (Data not shown). As a consequence, increasing the SRT from 5 to 55 days positively affected the CH4 gas production. CH4 gas production at 55 days of SRT was better than the productions at 5, 30 and 45 days of SRT conditions. This could be due to the high CH4 gas production at high retention time from the low TVFA without any accumulation in the anaerobic UASB reactor.
AHMT Removals in Continuous Operated Biological Reactors
The influent AHMT concentration was detected as 236 µg L−1in raw hospital wastewater (Table 4). AHMT removals in the supernatants of the continuous operated biological reactors during 5, 30, 45 and 55 days of SRT operations were shown in Table 4.
During the 55 days of SRT operation, the maximum AHMT yield of the anaerobic reactor was obtained as 40.7% with a AHMT effluent of 139.95 μg L−1 at an influent of 236.00 μg L−1. For the aerobic reactor, maximum AHMT yield was measured as 46.8% with an effluent of 74.45 μg L−1 at an influent of 139.95 μg L−1. For the anaerobic/aerobic sequential reactor system, AHMT yield reached 68.5% with an effluent of 74.45 μg L−1 at an influent of 236.00 μg L−1(Table 4). A linear correlation between AHMT removals and SRTs was found for anaerobic/aerobic sequential biological reactor system and this regression is significant (R2=0.98, P=0.0045).
In order to determine the main removal mechanism of 236.00 µg L−1 AHMT under aerobic and anaerobic conditions for the 55 days of SRT operation, abiotic and biotic batch tests were conducted. Adsorption onto the biological sludges of AHMT were found 508.43 µg for anaerobic biological sludge and 168.77 µg for aerobic biological sludge, according to the Equation 6 and Equation 8, respectively.
M1,anaerobic (µg) = (139.95 µg L−1) × (2.5 L) = 349.88 µg (Eq.5)
M2,anaerobic (µg) = [ (25421.5 ng mL−1) × (1 mL) / (10 gr)] × (200 gr) × 10-3 (µg ng−1) = 508.43 µg (Eq.6)
M1,aerobic (µg) = (74.45 µg L−1) × (2.0 L) = 148.90 µg (Eq.7)
M2,aerobic (µg) = [ (16877.0 ng mL-1) × (1 mL) / (10 gr)] × (100 gr) × 10-3 (µg ng-1) = 168.77 µg (Eq.8)
PUF disks were used for the volatilization study. After 55 days of incubation time, 1.330 and 0.493 µg of AHMT in the PUF disks under anaerobic and aerobic conditions, respectively, while it was determined that AHMT losses throughout volatilization were below 0.155% and 0.155% for anaerobic and aerobic reactors (Equation 9,11,12 and 14).
M3,anaerobic (µg) = (1330.0 ng mL-1) × (1 mL) × 10-3 (µg ng-1) = 1.330 µg (Eq.9)
MT,anaerobic = 349.88 + 508.43 + 1.330 = 859.64 µg (Eq.10)
Losses for volatilization - anaerobic = (1.330 × 100) / 859.64 = 0.155% (Eq.11)
M3,aerobic (µg) = (493.0 ng mL-1) × (1 mL) × 10-3 (µg ng-1) = 0.493 µg (Eq.12)
MT,aerobic = 148.90 + 168.77 + 0.493 = 318.16 µg (Eq.13)
Losses for volatilization - aerobic = (0.493 × 100) / 318.16 = 0.155% (Eq.14)
Therefore, it was concluded that volatilization is insignificant for AHMT removals. This indicated that AHMT was biodegraded 42.3% totally in the sequential anaerobic/aerobic biological reactor system and adsorbed onto biological sludges of the sequential anaerobic/aerobic biological reactor system as 57.5% (Equation 16 and 17).
MT-Sequential = 498.78 + 1.823 + 677.20 = 1177.80 µg (Eq.15)
Biodegradation in sequential system = (498.78 × 100) / 1177.80 = 42.3% (Eq.16)
Adsorption in sequential system = (677.20 × 100) / 1177.80 = 57.5% (Eq.17)
In sewage treatment plants, AHMT removal of approximately 50 to more than 90% mainly caused by sorption onto sludge particles has been reported [3]. The results of this study showed that aerobic and anaerobic adsorption onto biological sludges was the main removal mechanism for AHMT under aerobic and anaerobic conditions, while biodegradation was medium and volatilization of AHMT was found to be negligible. The findings of our data showed that anaerobic and aerobic sludges were the main reservoir of AHMT, and their potential entry into environmental AHMT.
| Anaerobic Reactor | Aerobic Reactor | Sequential Reactor | ||||||||||
| Biological Removal (in Supernatant) | Influent (µg L−1) | Effluent (µg L−1) | Removed (µg L−1) | Removal Efficiency (%) | Influent (µg L−1) | Effluent (µg L−1) | Removed (µg L−1) | Removal Efficiency (%) | Influent (µg L−1) | Effluent (µg L−1) | Removed (µg L−1) | Removal Efficiency (%) |
| SRT = 5 d | 236.00 | 188.33 | 47.67 | 20.2 | 188.33 | 142.00 | 46.33 | 24.6 | 236.00 | 142.00 | 94.00 | 39.8 |
| SRT = 30 d | 236.00 | 154.82 | 81.18 | 34.4 | 154.82 | 98.31 | 56.51 | 36.5 | 236.00 | 98.31 | 137.69 | 58.3 |
| SRT = 45 d | 236.00 | 145.38 | 90.62 | 38.4 | 145.38 | 85.48 | 59.90 | 41.2 | 236.00 | 85.48 | 150.52 | 63.8 |
| SRT = 55 d | 236.00 | 139.95 | 96.05 | 40.7 | 139.95 | 74.45 | 65.50 | 46.8 | 236.00 | 74.45 | 161.55 | 68.5 |
Conclusions
A comparative assessment of the biodegradation of AHMT with anaerobic/aerobic sequential biological reactor system under 5, 30, 45 and 55 days of SRT operations was investigated to evaluate the efficiency of the best SRT operation. 55 days of SRT operation under mesophilic conditions removed AHMT 42.3% with biodegradation from the supernatant while adsorption removal efficiency reached 57.5% in the biological sludge in the anerobic UASB/aerobic CSTR sequential biological reactor system. As a result of the study, increasing of the SRT has a positive effect on AHMT removals from the raw hospital wastewater effluents in anaerobic/aerobic sequential biological reactor system under mesophilic conditions.
Acknowledgment
The authors thank to The Scientific and Technological Research Council of Turkey (TUBITAK) for the Ph.D. Dissertation Grant of Gokce GUNEY on the Priority Section Subjects (Grant number 2211-C Prior Sections; Water; Prior, Specific and Micro Pollutants).
References
- Petrie B, McAdam EJ, Lester JN, et al. 2014. Obtaining Process Mass Balances of Pharmaceuticals and Triclosan to Determine Their Fate During Wastewater Treatment. Science of the Total Environment. 553-560. [Ref.]
- Valdersnes S, Kallenborn R, Sydnes LK. 2006. Identification of Several Tonalide Transformation Products in the Environment. International Journal of Environmental Analytical Chemistry. 86: 461-471.[Ref.]
- Martin C, Moeder M, Daniel X, et al. 2007. Biotransformation of the Polycyclic Musks HHCB and AHTN and Metabolite Formation by Fungi Occurring in Freshwater Environments. Environmental Science & Technology. 41: 5395-5402. [Ref.]
- Cunha SC, Fernandes JO, Vallecillos L, et al. 2015. Co-occurrence of musk fragrances and UV-filters in seafood and macroalgae collected in European hotspots, Environmental Research. 143: 65-71. [Ref.]
- Fan M, Liu Z, Dyer S, et al. 2017. Environmental risk assessment of polycyclic musks HHCB and AHTN in consumer product chemicals in China; Science of The Total Environment. 771-779. [Ref.]
- Godayol A, Besalú E, Anticó E, et al. 2015. Monitoring of sixteen fragrance allergens and two polycyclic musks in wastewater treatment plants by solid phase microextraction coupled to gas chromatography, Chemosphere. 119: 363-370. [Ref.]
- Saraiva M, Cavalheiro J, Lanceleur L, et al. 2016. Synthetic musk in seafood products from south Europe using a quick, easy, cheap, effective, rugged and safe extraction method; Food Chemistry. 200: 330-335. [Ref.]
- Santiago-Morales J, Jose´ Go´mez M, Herrera S. 2012. Oxidative and photochemical processes for the removal of galaxolide and tonalide from wastewater; Water Research. 46: 4435-4447. [Ref.]
- Wang L, Kaushalya C, Wijekoon M, et al. 2014. Removal of polycyclic musks by anaerobic membrane bioreactor: Biodegradation, biosorption, and enantioselectivity, Chemosphere. 117: 722-729. [Ref.]
- Zhang X, Zheng M, Wang L, et al. 2018. Sorption of three synthetic musks by microplastics, Marine Pollution Bulletin. 126: 606-609. [Ref.]
- United States Environmental Protection Agency EPI SuiteTM Database 2017.[Ref.]
- Simonich SL, Begley WM, Debaere G, et al. 2000. Trace Analysis of Fragrance Materials in Wastewater and Treated Wastewater. Environmental Science & Technology. 34: 959-965.[Ref.]
- Chokwe TB, Okonkwo JO, Sibali LL, et al. 2015. An Integrated Method for the Simultaneous Determination of Alkylphenol Ethoxylates and Brominated Flame Retardants in Sewage Sludge Samples by Ultrasonic-assisted Extraction, Solid Phase Clean-up, and GC-MS Analysis. Microchemical Journal. 123: 230-236.[Ref.]
- American Public Health Association/American Water Works Association/Water Environment Federation. 1998. Standard Methods for the Examination of Water and Wastewater. 20th ed. Washington, DC: American Public Health Association.[Ref.]
- Anderson GK, Yang G. 1992. Determination of Bicarbonate and Total Volatile Acid Concentration in Anaerobic Digesters Using a Simple Titration. Water Environment Research. 64: 53-59.[Ref.]
- Razo-Flores E, Luijten M, Donlon BA, et al. 1997. Complete Biodegradation Azo Dye Azodisalicylate Under Anaerobic Conditions. Environmental Science & Technology. 31: 2098-2103.[Ref.]
- Zhang SJ, Liu NR, Zhang CX. 2012. Study on the Performance of Modified UASB Process Treating Sewage. Advanced Materials Research. 2174-2178.[Ref.]
- Rajakumar R, Meenambal T, Rajesh Banu J. et al. 2011. Treatment of Poultry Slaughterhouse Wastewater in Upflow Anaerobic Filter Under Low Upflow Velocity. International Journal of Environmental Science & Technology. 8: 149-158.[Ref.]
- Nkemka VN, Murto M. 2010. Evaluation of Biogas Production from Seaweed in Batch Tests and in UASB Reactors Combined with the Removal of Heavy Metals. Journal of Environmental Management. 91: 1573-1579.[Ref.]
- Al-Hashimi MA, Abbas AH. 2007. Sequential Anaerobic/Aerobic Treatment of Pharmaceutical Wastewater. Tikrit Journal of Engineering Sciences. 14: 1-31.[Ref.]
- Chelliapan S, Sallis PJ. 2011. Application of Anaerobic Biotechnology for Pharmaceutical Wastewater Treatment. The IIOAB Journal. 2: 13-21. [Ref.]
- Sánchez E, Borja R, Travieso L, et al. 2005. Effect of Organic Loading Rate on the Stability, Operational Parameters and Performance of a Secondary Upflow Anaerobic Sludge Bed Reactor Treating Piggery Waste. Bioresource Technology. 96: 335-344. [Ref.]
- Malpei F, Andreoni V, Daffonchio D, et al. 1998. Anaerobic Digestion of Print Pastes: a Preliminary Screening of Inhibitionby Dyes and Biodegradability of Thickeners. Bioresource Technology. 63: 49-56. [Ref.]
- Darcy AC, Adcharee K, Yu F, et al. 2012. Occurrence of synthetic musk fragrances in effluent and non-effluent impacted environments, Science of The Total Environment. 416: 253-260.[Ref.]