Indexing & Abstracting
Full Text
Review ArticleDOI Number : 10.36811/jca.2021.110009Article Views : 54Article Downloads : 26
Cyanoacetamide derivatives as corrosion inhibitors; Synthesis, Characterization, DFT and Monte Carlo simulation
A.N. El-hoshoudy1*, M. Abd El-Raouf1, M. M. Attya2, Ahmed A. Fadda3 and M. Waly3
1Egyptian Petroleum Research Institute (EPRI), Nasr City, Cairo, Egypt
2Gas Engineering Department, Apache Khalda Corporation, Cairo, Egypt
3Department of Chemistry, Faculty of Science, Mansoura University, ET-35516 Mansoura, Egypt
*Corresponding Author: A.N. El-hoshoudy, Egyptian Petroleum Research Institute (EPRI), Nasr City, Cairo, Egypt, Email: azizchemist@yahoo.com
Article Information
Aritcle Type: Review Article
Citation: El-hoshoudy AN, Abd El-Raouf M, Attya MM, et al. 2021. Cyanoacetamide derivatives as corrosion inhibitors; Synthesis, Characterization, DFT and Monte Carlo simulation. J Chem Appl. 3: 33-53.
Copyright: This is an open-access article distributed under the terms of the Creative Commons Attribution License, which permits unrestricted use, distribution, and reproduction in any medium, provided the original author and source are credited. Copyright © 2021; El-hoshoudy AN
Publication history:
Received date: 16 April, 2021Accepted date: 05 May, 2021
Published date: 07 May, 2021
Abstract
Corrosion behavior of X65-type carbon steel exposed to 1M HCl aqueous solution was studied in the absence and presence of various concentrations of new synthesized 3-(4-chlorophenyl)-2-cyano-N-(4-hydroxyphenyl) acrylamide, abbreviated as (P2), and 6-amino-4-(4-chlorophenyl)-1-(4-hydroxyphenyl)-2-oxo-1,2-dihydropyridine-3,5-dicarbonitrile, abbreviated as (P3), at 25oC. Potentiodynamic polarization data indicated that the synthesized Cyanoacetamide derivatives suppress both anodic and cathodic reactions via adsorption on the carbon steel surface and blocking the active sites. The adsorption of the inhibitor molecules forms a protective film which decreases the surface heterogeneity. Electrochemical impedance spectroscopy (EIS) measurements reveal that as the inhibitor concentration is increased, both the inhibition efficiency (η%) and the charge transfer resistance (Rt) are increased while the electrochemical double layer capacity (Cdl) is decreased. The experimental impedance data were analyzed according to a proposed equivalent circuit model for the electrode/electrolyte interface. Chemical descriptors are calculated through the density functional theory (DFT), also adsorption of inhibitors on the metal surface investigated through Monte Carlo simulation. The mechanism of corrosion inhibition was discussed given the obtained results of surface analysis and the molecular structure of the additive obtained from quantum chemical calculations.
Keywords: Corrosion inhibition; Polarization; Electrochemical impedance spectroscopy (EIS); Surface analysis; Quantum chemical calculations
Introduction
Cyanoacetamide-N-derivatives are privileged structures and considered one of the most important precursors for heterocyclic synthesis [1-3]. The simplest and most convergent preparation of this class of compounds has been described elsewhere [4,5]. They are extensively utilized as reactants or reaction intermediates since the carbonyl group, the active hydrogen on C2, and the cyano function of these compounds are suitably positioned to enable reactions with common reagents to form a variety of heterocyclic compounds with pharmacological applications, for example, antitumor [6,7], anti-inflammatory [8,9], and antibacterial and antifungal [10-13] activity, in addition to other medicinal applications [14,15]. Recently many derivatives of cyanoacetamide were reported as a new class of corrosion inhibitors [16,17]. Computational and theoretical methods are a considerable tool to calculate chemical and quantum descriptors based on theoretical assumptions [18-21]. Molecular dynamics (MD) simulation used currently to investigate the orientation of corrosion inhibitors over the metal surface [22-24]. Furthermore, density functional theory (DFT) approximates the inhibition efficiency of the inhibitors through their electronic molecular structure [25]. In the current work, the inhibition efficiency of two synthesized inhibitors as displayed in Scheme 1 was evaluated on the metal surface. Chemical hardness, electronegativity, chemical potential, electrophilicity, and nucleophilicity as widely used chemical descriptors have been investigated to assess the accomplishment between experimental results and theoretical approaches [26,27]. Based on the molecular structure of the inhibitors, these descriptors will assess the inhibition efficiency in terms of chemical reactivity [28]. Also, a Monte Carlo simulation was conducted to calculate the inhibitor’s adsorption energy on the iron (Fe) crystal surface [29].
Materials and Methods
Chemical composition of the investigated carbon steel alloy
Carbon steel specimens used in this investigation were cut from unused petroleum pipelines having the chemical composition of carbon steel alloy is listed in table 1.
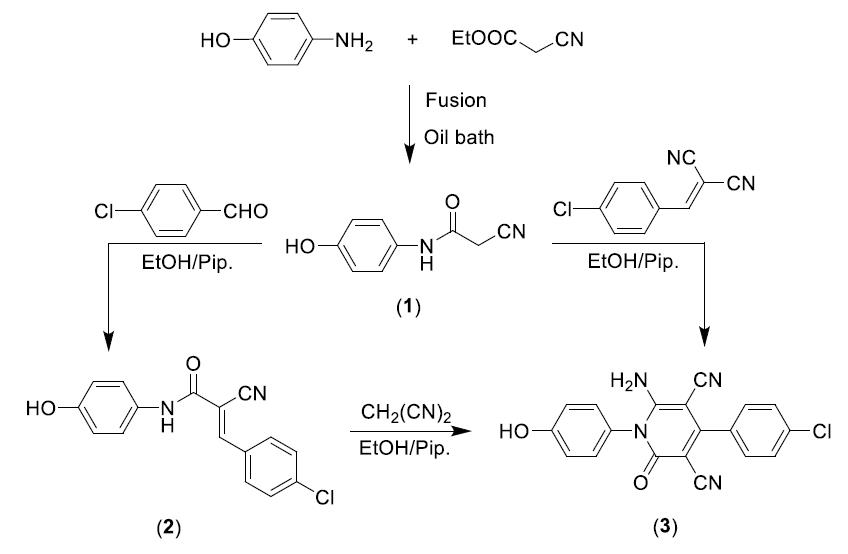
Scheme 1: Chemical structure of the synthesized inhibitors.
|
Table 1: Chemical composition of carbon steel alloy. |
|||||||||||||
|
Element |
C |
Si |
Mn |
P |
S |
Ni |
Cr |
Mo |
V |
Cu |
Al |
Fe |
|
|
Content (Wt %) |
0.09 |
0.22 |
1.52 |
0.01 |
0.05 |
0.04 |
0.02 |
0.004 |
0.002 |
0.02 |
0.04 |
rest |
|
Corrosive medium
The corrosive medium employed in this study is a 1M HCl aqueous solution. The selection of this corrosive medium was made to simulate the oil wells acidizing jobs that are frequently executed to stimulate oil production. During the acidizing process, the oil well, tubing is susceptible to acidic corrosion on the internal surface of the production tube.
Synthesis and characterization of 2-cyano-N-(4-hydroxyphenyl) acetamide [P1]
An equimolar amount of p-aminophenol and ethyl cyanoacetate were fused in an oil bath for 30 minutes then left to cool. The formed solid product was washed with ethanol, dried, and recrystallized from a mixture of DMF and ethanol (1:5) to give yellowish-brown powder; with a yield of 91%, and melting point 228-230?C. The chemical structures of the synthesized compounds were confirmed using FTIR, 1H NMR, and mass spectra. The spectroscopic analysis of the different compounds showed their chemical structures as represented in Scheme 1. IR (KBr): υ/cm-1= 3391 (OH), 3311 (NH), 2268 (C≡N), 671 (C=O).1H NMR (DMSO-d6): δ 3.82 (s, 2H, CH2), 6.75 (d, 2H, 2ArCH aa, AB system), 7.35 (d, 2H, 2ArCH bb, AB system), 9.29 (s, 1H, OH), 10.03 (s, 1H, N–H). MS m/z (%): 177 (M++1, 7.26), 167 (M+, 67.21), 136 (4.69), 135 (17.08), 108 (100.00), 81 (22.67), 68 (17.02).
Synthesis and characterization of 3-(4-chlorophenyl)-2-cyano-N-(4-hydroxyphenyl) acrylamide [P2]
To an ethanolic solution of the 2-cyano-N-(4-hydroxyphenyl) acetamide (0.35 g, 2 mmol) and p-chlorobenzaldehyde (0.28 g, 2 mmol) was added few drops of piperidine, and the reaction mixture was refluxed for 30 min. The obtained solid product was collected by filtration, washed with ethanol, and then crystallized from a mixture of ethanol and DMF (4:1) to give yellow crystals; yield 89%; melting point 150-160?C. IR (KBr): υ/cm-1= 3417 (OH), 3328 (NH), 2221 (C≡N), 1671 (C=O). 1H NMR (DMSO-d6): δ 6.74 (d, 2H, 2ArCH aa, AB system), 7.45 (d, 2H, 2ArCH bb, AB system), 7.66 (d, 2H, 2ArCH a\a\, AB system), 7.97 (d, 2H, , 2ArCH b\b\, AB system), 8.22 (s, 1H, =CH), 9.34 (s, 1H, OH), 10.16 (s, 1H, N–H). MS m/z (%): 300 (M++2, 46.03), 298 (M+, 100.00), 232 (7.77), 190 (62.56), 162 (23.12), 127 (34.06), 108 (40.16).
Synthesis and characterization of 6-amino-4-(4-chlorophenyl)-1-(4-hydroxyphenyl)-2-oxo-1,2- dihydropyridine-3,5-dicarbonitrile [P3]
Method A: To a solution of the 2-(4-chlorobenzylidene) malononitrile (0.37 g, 2 mmol) in ethanol (20 mL) was added the 2-cyano-N-(4-hydroxyphenyl) acetamide (0.35 g, 2 mmol), and few drops of piperidine and the reaction mixture was heated under reflux for 1 h. The formed solid product was collected by filtration, washed with EtOH, and then crystallized from ethanol/DMF mixture (3:1).
Method B: To a solution of 3-(4-chlorophenyl)-2-cyano-N-(4-hydroxyphenyl) acrylamide (0.59g, 2 mmol) in ethanol (20 mL) was added malononitrile (0.13g, 2 mmol) and few drops of piperidine, and a reaction mixture was heated under reflux for 2h. The obtained solid product was collected by filtration, washed with ethanol, and then crystallized from ethanol/DMF mixture (3:1) to give yellow crystals; yield 71% [2]; a melting point above 300?C. IR (KBr): υ/cm-1= 3422 (OH), 3315, 3221 (NH2), 2212, 2193 (2 C≡N), 1671 (C=O). 1H NMR (DMSO-d6): δ 6.91 (d, 2H, 2ArCH aa, AB system), 7.14 (d, 2H, , 2ArCH bb, AB system), 7.56 (d, 2H, , 2ArCH b\b\, AB system), 7.66 (d, 2H, 2ArCH a\a\, AB system), 7.82 (s, 2H, NH2), 9.88 (s, 1H, OH). MS m/z (%): 364 (M++2, 33.79), 362 (M+, 100.00), 349 (8.95), 334 (23.02), 241 (29.28), 214 (20.90), 135 (19.89). The spectroscopic characterization of inhibitor P3 including (FT-IR spectra as well as H1-NMR and mass spectroscopy) are provided in Supplementary data (Figures S1-S3). The surface examination was carried out using a scanning electron microscope (JEOL JSM- 5410, Japan). The energy of the acceleration beam employed was 20KV. All micrographs were taken at a magnification power (100- 500X). EDX system attached with a JEOL JSM-5410 scanning electron microscope was used for the elemental analysis or chemical characterization of the surface of carbon steel before and after applying the synthesized P2 and P3 inhibitor.
Potentiodynamic polarization measurements
A conventional three-electrode glass cell, consisting of the carbon steel working electrode (WE), a platinum counter electrode (CE), and a saturated calomel electrode (SCE) as a reference electrode, was used for electrochemical measurements as illustrated in igure 1. The electrochemical measurements were carried out using Volta lab80 (Tacusselradiometer PGZ402) controlled by the Tacussel corrosion analysis software model (Volta master 4). All the measurements were carried out in air-saturated solutions and at ambient temperature (25 oC). The working electrode was first immersed in the formation water for 1.0 hours to establish a steady-state open circuit potential (Eocp). The open-circuit potential for the working electrode was recorded over time for 3 hours under the testing solution at 25 oC with and without different concentrations of the synthesized P2 and P3 inhibitors. The test period was maintained to ensure achieving a stable potential value. After determining the open circuit potential, potentiodynamic polarization curves were obtained by changing the applied electrode potential automatically from -900 mV to -30 mV with a scan rate of 1 mV/s in both cathodic and anodic potentials to investigate the polarization behavior.
Electrochemical impedance spectroscopy (EIS)
Impedance spectra were obtained in the frequency range between 100 kHz and 50 MHz using 20 steps per frequency decade at open circuit potential after 3 hours of immersion time. AC signal with a 20-mV amplitude peak to peak was used to perturb the system. EIS diagrams are given in Nyquist representation.
Results and Discussion
Potentiodynamic polarization measurements
Figure 2 displays the cathodic and anodic polarization curves of carbon steel immersed in deep oil wells produced water in the absence and presence of different concentrations of the synthesized inhibitor. Electrochemical parameters such as corrosion potential (Ecorr.), corrosion current density (icorr.), cathodic and anodic Tafel slopes (bc and ba), and polarization resistance (Rp) were calculated. From the obtained polarization curves, the corrosion current densities (icorr.) were decreased with increasing inhibitor concentration concerning the blank (inhibitor-free solution). These results indicate the production of a good protective layer on the surface of carbon steel. The degree of surface coverage (θ) and the percentage inhibition efficiency (IE %) was calculated using the following equations [17].
where io and i are the corrosion current densities in the absence and presence of the inhibitor, respectively. The values of polarization resistance (Rp) were calculated from the wellknown Stern - Geary equation.
From the obtained data, the Tafel lines are shifted to more negative and more positive potentials for the anodic and cathodic processes, respectively relative to the blank curve. This means that the selected compound acts as a mixed type inhibitor, i.e., promoting retardation of both anodic and cathodic discharge reactions. Also, the slopes of the cathodic and anodic Tafel lines are approximately constant and independent of the inhibitor concentration. This means that the selected inhibitor does not affect the metal dissolution mechanism. Complete data obtained from polarization measurements for inhibitors P2 and P3 are summarized in tables 2 and 3, respectively.
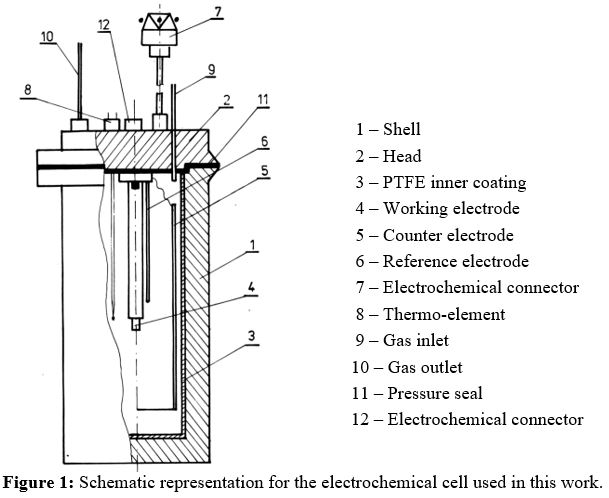
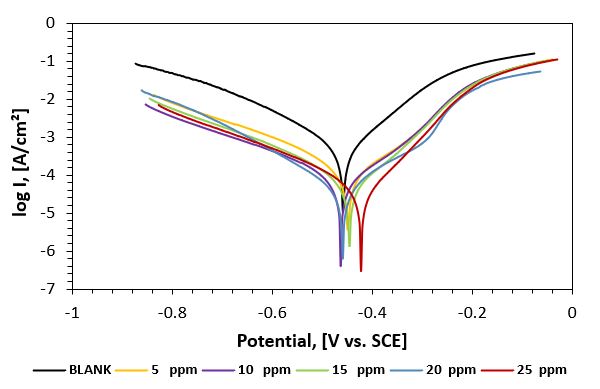
Figure 2: Potentiodynamic polarization curves of carbon steel in 1M HCl aqueous solution in the absence and presence of different concentrations of P2 inhibitor at 25oC.
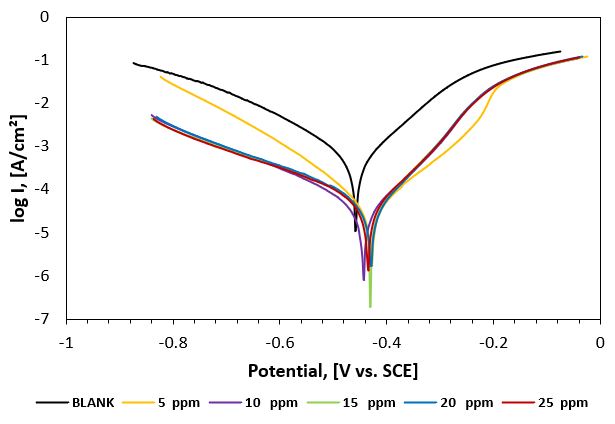
Figure 3: Potentiodynamic polarization curves of carbon steel in 1M HCl aqueous solution in the absence and presence of different concentrations of P3 inhibitor at 2oC.
Electrochemical impedance spectroscopy (EIS)
The corrosion behavior of carbon steel in deep oil wells produced water in the absence and presence of various concentrations of the synthesized inhibitor was investigated by the EIS technique. Nyquist and Bode's plots are shown in figures 3-5, respectively. It is clear from the plots that the impedance response of carbon steel in produced water was significantly changed after the addition of the inhibitor molecules. Various parameters such as the charge transfer resistance (Rt), double layer capacitance (Cdl), and percentage inhibition efficiency IE % were calculated according to the following equations and listed in tables 4 and 5, respectively. The values of Rt were given by subtracting the high-frequency impedance from the low-frequency one as follows [30].
The values of Cdl were obtained at the frequency , at which the imaginary component of the impedance is maximal – Zmax using the following equation.
The percentage inhibition efficiency IE % was calculated from the values of Rt using the following equation.
Where Rt and Rt (inh) are the charge transfer resistance values in the absence and presence of inhibitor, respectively. Increasing the value of charge transfer resistance (Rt) and decreasing the value of double-layer capacitance (Cdl) by increasing the inhibitor concentration indicates that the surfactant molecules inhibit the corrosion rate of carbon steel in deep oil wells produced water by adsorption mechanism [31].
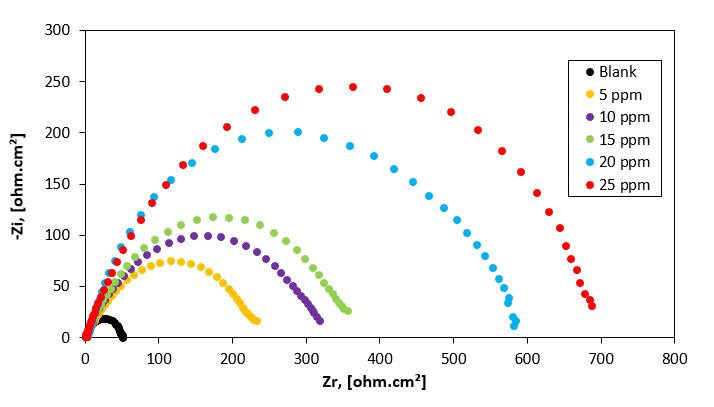
Figure 4: Nyquist plots for carbon steel in 1M HCl aqueous solution in the absence and presence of different concentrations of P2 inhibitor at 25 oC.
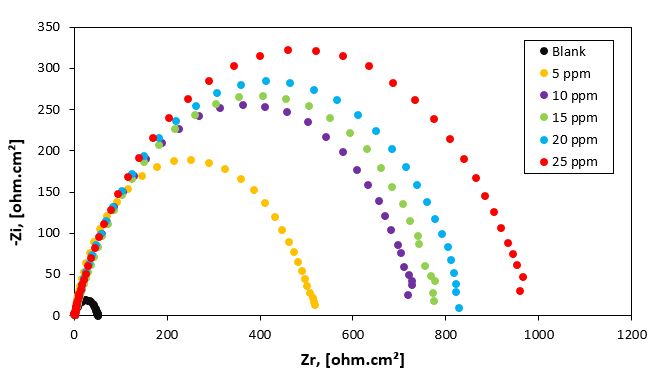
Figure 5: Nyquist plots for carbon steel in 1M HCl aqueous solution in the absence and presence of different concentrations of P3 inhibitor at 25 oC.
|
Table 2: Data obtained from potentiodynamic polarization measurements of carbon steel in 1M HCl aqueous solution in the absence and presence of various concentrations of P2 inhibitor at 25 oC. |
||||||||
|
Conc. (ppm) |
-Ecorr (mV) |
Icorr (μA/cm²) |
Corrosion rate (mm/year) |
Rp (ohm.cm2) |
βa (mV dec-1) |
βc (mV dec-1) |
θ |
IE (%) |
|
Blank |
457.62 |
546 |
6.345 |
49.51 |
106.65 |
149.48 |
- |
- |
|
5 |
448.85 |
94.55 |
1.099 |
297.19 |
107.8 |
161.84 |
0.83 |
82.68 |
|
10 |
462.64 |
69.15 |
0.803 |
434.33 |
106.55 |
197.03 |
0.87 |
87.34 |
|
15 |
446.46 |
61.56 |
0.715 |
418.61 |
88.752 |
178.99 |
0.89 |
88.73 |
|
20 |
459.82 |
41.35 |
0.480 |
702.61 |
134.04 |
133.55 |
0.92 |
92.43 |
|
25 |
422.48 |
37.44 |
0.435 |
596.16 |
73.502 |
170.9 |
0.93 |
93.14 |
|
Table 3: Data obtained from potentiodynamic polarization measurements of carbon steel in 1M HCl aqueous solution in the absence and presence of various concentrations of P3 inhibitor at 25 oC. |
||||||||
|
Conc. (ppm) |
-Ecorr (mV) |
Icorr (μA/cm²) |
Corrosion rate (mm/year) |
Rp (ohm.cm2) |
βa (mV dec-1) |
βc (mV dec-1) |
θ |
IE (%) |
|
Blank |
457.62 |
546 |
6.345 |
49.51 |
106.65 |
149.48 |
- |
- |
|
5 |
430.96 |
43.99 |
0.511 |
497.46 |
68.57 |
190.01 |
0.919 |
91.94 |
|
10 |
431.03 |
41.02 |
0.477 |
591.59 |
77.78 |
198.35 |
0.925 |
92.49 |
|
15 |
443.12 |
36.68 |
0.426 |
686.77 |
82.88 |
193.19 |
0.933 |
93.28 |
|
20 |
429.96 |
34.92 |
0.406 |
648.74 |
75.77 |
167.42 |
0.936 |
93.60 |
|
25 |
434.63 |
30.96 |
0.360 |
719.41 |
79.77 |
143.62 |
0.943 |
94.33 |
|
Table 4: Data obtained from electrochemical impedance spectroscopy (EIS) measurements of carbon steel in 1M HCl aqueous solution in the absence and presence of various concentrations of the P2 inhibitor at 25 oC. |
||||||
|
Concentration, (ppm) |
Coefficient |
Rs, (ohm.cm²) |
Rt, (kohm.cm²) |
Cdl, (µF/cm²) |
θ |
IE% |
|
Blank |
0.979 |
1.5 |
49.0 |
229.1 |
- |
- |
|
5 |
0.999 |
2.7 |
230.2 |
192.7 |
0.79 |
78.7 |
|
10 |
0.972 |
1.2 |
322.5 |
148.9 |
0.85 |
84.8 |
|
15 |
0.994 |
2.3 |
359.3 |
108.2 |
0.86 |
86.4 |
|
20 |
0.991 |
1.9 |
586.9 |
98.9 |
0.92 |
91.7 |
|
25 |
0.988 |
2.5 |
699.1 |
34.7 |
0.93 |
93.0 |
Scanning electron microscopy (SEM)
Figure 6a shows an SEM image of a polished carbon steel surface. The micrograph shows a characteristic inclusion, which was probably an oxide inclusion [32]. Figure 6b shows SEM of the surface of the carbon steel specimen after immersion in produced water for 30 days in absence of an inhibitor, while figure 6c shows SEM of the surface of another carbon steel specimen after immersion in produced water for the same time interval in presence of 150 ppm of the synthesized inhibitor. The resulting scanning electron micrographs reveal that the surface was strongly damaged in absence of the inhibitor, but in presence of 150 ppm of the inhibitor, there is less damage to the surface. This confirms the observed high inhibition efficiency of the inhibitor at this concentration.
Energy Dispersive Analysis of X-Rays (EDX)
EDX spectrum in Figure 6a shows the characteristic peaks of some of the elements constituting the polished carbon steel surface. The spectrum of the polished carbon steel surface after immersion in the produced water in the absence and presence of the inhibitor for 30 days, are shown in figure 6b& c, respectively. The spectra of Figure 6c show that the Fe peak is considerably decreased relative to the samples in Figure 6a & b. This decrease of the Fe band is indicated that the strongly adherent protective film of the inhibitor formed on the polished carbon steel surface, which leads to a high degree of inhibition efficiency [33]. The oxygen signal apparent in Figure 6b is due to the carbon steel surface exposed to the produced water in absence of the inhibitor. Therefore, EDX and SEM examinations of the carbon steel surface support the results obtained from electrochemical methods that the synthesized surfactant inhibitor is a good inhibitor for the carbon steel in the oil wells produced water.
Computational Calculations
Monte Carlo simulation
Monte Carlo simulation was conducted to explore the alignment and the lowest configuration adsorption energies of the two inhibitors on the metallic iron surface in the aqueous phase. Inhibitor molecules were geometry optimized using the for cite module applying the COMPASSII force field with Gasteiger charges, and Quasi-Newton algorithms at a fine quality [29]. The electrostatic and Vander Waals forces calculated using atom and group-based, respectively. annealing simulation conducted between the inhibitor molecules and Fe crystal built with a surface cleavage of (-111) and vacuum slab thickness of 30.00 Å in a simulation box (4.05 °A× 4.05 °A× 30.82 °A) with periodic boundary conditions alongside with 5 water molecules [34]. The adsorbed inhibitors were translated and rotated around the metal surface to screen the minimum adsorption energy sites for attachment [29]. A sequence of NVT (canonical ensemble) calculations were performed at 300 K and 1 atm with a timestep of 0.5 fs [17]. Figure 7 displays the configuration outputs from the annealing simulation. The chemical descriptors outputs from the MC simulation are listed in table 5,6. The adsorption energy is an indicator of inhibitor efficiency. The more negative value of adsorption energies reveals the higher inhibition efficiency [22,26,29,35,36]. The obtained results in table 6 indicate that the inhibition efficiency of P2 inhibitors is higher than that of the P3 inhibitor.
|
Table 5: Data obtained from electrochemical impedance spectroscopy (EIS) measurements of carbon steel in 1M HCl aqueous solution in the absence and presence of various concentrations of the P3 inhibitor at 25 oC. |
||||||
|
Concentration, (ppm) |
Coefficient |
Rs, (ohm.cm²) |
Rt, (kohm.cm²) |
Cdl, (µF/cm²) |
θ |
IE% |
|
Blank |
0.979 |
1.5 |
49.0 |
229.1 |
- |
- |
|
5 |
0.993 |
2.8 |
516.8 |
98.9 |
0.91 |
90.5 |
|
10 |
0.985 |
2.6 |
739.9 |
97.6 |
0.93 |
93.4 |
|
15 |
0.989 |
2.4 |
789.0 |
89.6 |
0.94 |
93.8 |
|
20 |
0.997 |
1.9 |
842.1 |
78.2 |
0.94 |
94.2 |
|
25 |
0.990 |
1.2 |
983.9 |
72.3 |
0.95 |
95.0 |
|
Table 6: Chemical descriptors computed by the MC simulation for the reported inhibitors. |
|
|||||
|
MC descriptors for P2 inhibitor |
|
|||||
|
Structures |
Total energy |
Adsorption energy |
Rigid adsorption energy |
Deformation energy |
P2 : dEad/dNi |
H2O : dEad/dNi |
|
Fe (-1 1 1) - 1 |
67.88269379 |
-392.97544647 |
50.43351940 |
-443.40896587 |
-223.19703893 |
-36.26697181 |
|
Fe (-1 1 1) - 2 |
69.33247197 |
-391.52566830 |
51.28867922 |
-442.81434752 |
-227.43088863 |
-37.19090390 |
|
Fe (-1 1 1) - 3 |
69.90741559 |
-390.95072467 |
52.98647063 |
-443.93719530 |
-230.88509315 |
-34.79995454 |
|
Fe (-1 1 1) - 4 |
70.18238494 |
-390.67575532 |
53.26913686 |
-443.94489218 |
-223.06596362 |
-35.10957653 |
|
Fe (-1 1 1) - 5 |
70.49149355 |
-390.36664671 |
53.48781677 |
-443.85446348 |
-223.11584141 |
-35.54520819 |
|
Fe (-1 1 1) - 6 |
70.87335588 |
-389.98478438 |
53.88512054 |
-443.86990492 |
-229.51794844 |
-35.97194977 |
|
Fe (-1 1 1) - 7 |
71.33366517 |
-389.52447510 |
54.97667421 |
-444.50114931 |
-222.71381808 |
-35.37157546 |
|
Fe (-1 1 1) - 8 |
71.91369440 |
-388.94444586 |
54.06082869 |
-443.00527456 |
-227.02263641 |
-37.54443502 |
|
Fe (-1 1 1) - 9 |
72.60618508 |
-388.25195519 |
54.91363468 |
-443.16558986 |
-227.11959510 |
-36.03445885 |
|
Fe (-1 1 1) - 10 |
73.07910164 |
-387.77903862 |
55.28849145 |
-443.06753007 |
-227.93181195 |
-34.63524736 |
|
MC descriptors for P3 inhibitor |
|
|||||
|
Structures |
Total energy |
Adsorption energy |
Rigid adsorption energy |
Deformation energy |
P3 : dEad/dNi |
H2O : dEad/dNi |
|
Fe (-1 1 1) - 1 |
591.28877497 |
-117.94720461 |
386.68521181 |
-504.63241643 |
45.11693388 |
-38.38668267 |
|
Fe (-1 1 1) - 2 |
591.85941767 |
-117.37656192 |
386.23829981 |
-503.61486173 |
48.00791853 |
-39.31475606 |
|
Fe (-1 1 1) - 3 |
592.22935342 |
-117.00662617 |
386.97297937 |
-503.97960553 |
48.17312511 |
-39.51740113 |
|
Fe (-1 1 1) - 4 |
592.82407168 |
-116.41190791 |
387.78975605 |
-504.20166396 |
49.20286227 |
-39.64943306 |
|
Fe (-1 1 1) - 5 |
593.04471017 |
-116.19126942 |
388.95554806 |
-505.14681748 |
45.71359050 |
-38.07056052 |
|
Fe (-1 1 1) - 6 |
593.50208015 |
-115.73389944 |
389.38118420 |
-505.11508364 |
45.03914864 |
-38.02989046 |
|
Fe (-1 1 1) - 7 |
594.46015995 |
-114.77581964 |
387.63876576 |
-502.41458540 |
51.33624495 |
-38.90272510 |
|
Fe (-1 1 1) - 8 |
595.16657007 |
-114.06940952 |
390.44683719 |
-504.51624671 |
51.84292535 |
-39.86295907 |
|
Fe (-1 1 1) - 9 |
595.74881126 |
-113.48716832 |
390.52790589 |
-504.01507422 |
47.44533191 |
-38.33210013 |
|
Fe (-1 1 1) - 10 |
596.19597052 |
-113.04000907 |
391.25200822 |
-504.29201730 |
48.64770360 |
-38.31975613 |
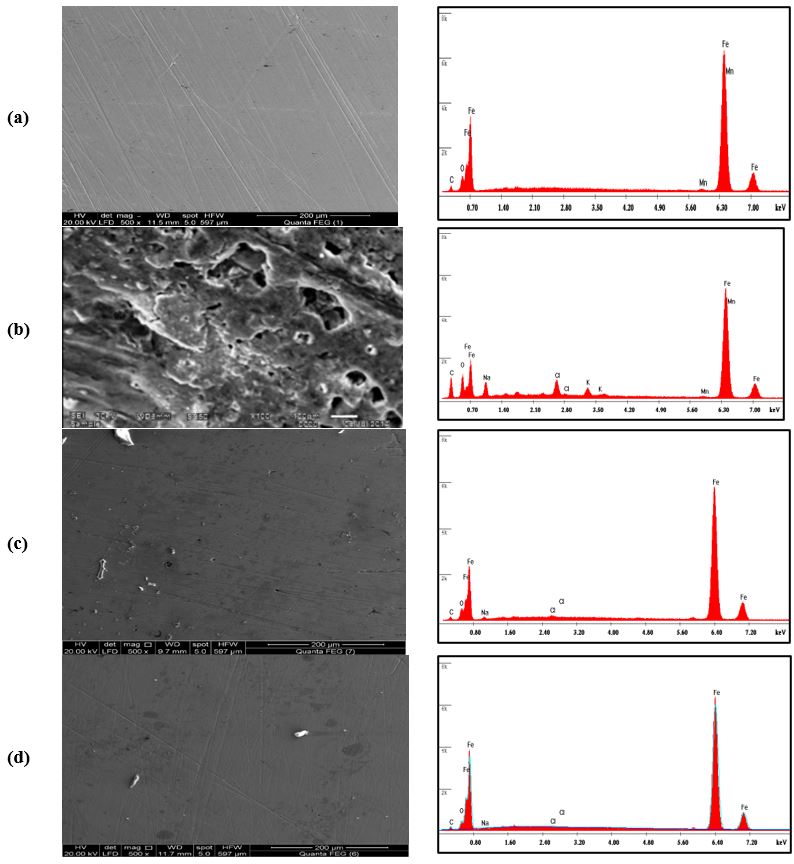
Figure 6: SEM images and EDX spectra for the carbon steel surface: a) polished sample, (b) after immersion in 1M HCl aqueous solution, (c) after immersion in 1M HCl aqueous solution in the presence of 25 ppm of P2 inhibitor, and (d) after immersion in 1M HCl aqueous solution in the presence of 25 ppm of P3 inhibitor.
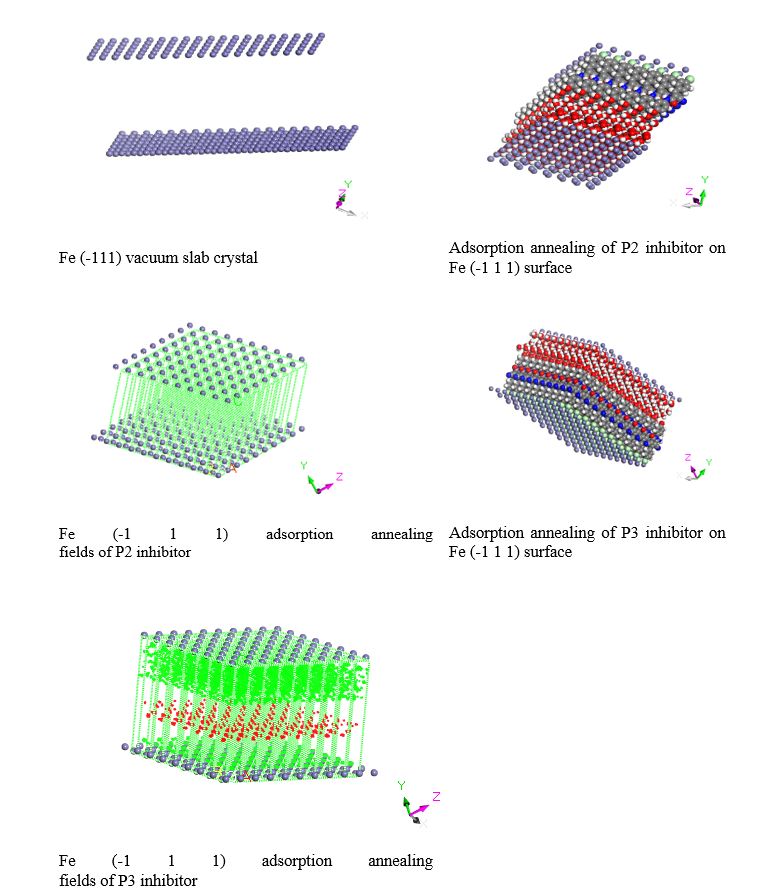
Figure 7: Monte Carlo annealing simulation of the adsorbed inhibitors on Fe (-111) surface.
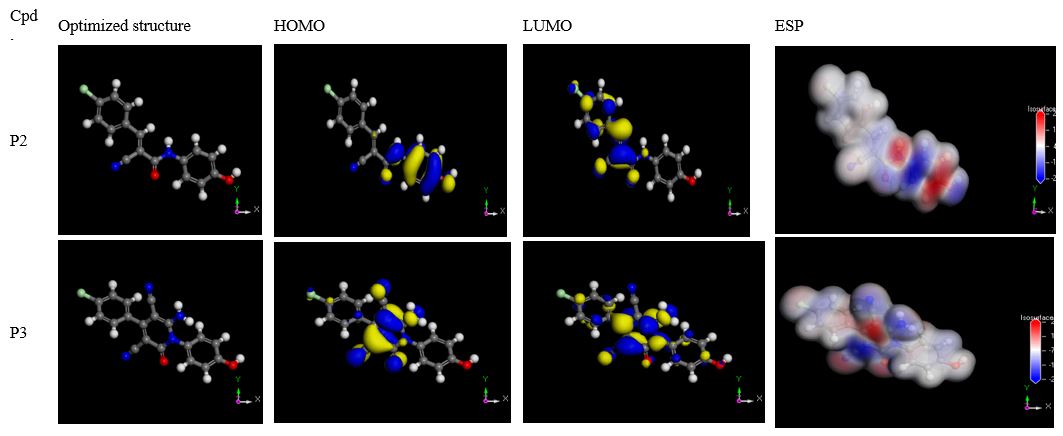
Figure 8: Optimized structures, HOMO, LUMO, and Electron density in the gas phase.
Density function theory (DFT)
DFT calculations are widely implemented in computational chemistry due to the reliability and compatibility of their predictions with the experimental data [37]. Moreover, B3LYP has been assigned for systems comprising transition metal atoms during corrosion inhibition study, since the inhibitor adsorption on the metal surface depends on donor-acceptor interaction between the conjugated π-electrons of the heterocyclic atom and the vacant d-orbitals of the metal atoms [37]. Density functional theory (DFT) was conducted at the Becke’s three-parameter exchange functional (B3) along with the Lee-Yang-Parr (LYP) gradient corrected nonlocal correlation functional (B3LYP) at medium quality [22,25,26,34,38]. The relation of the quantum chemical descriptors to the corrosion inhibition behavior of the reported inhibitors was investigated [38]. The definition and formula of these chemical descriptors are reported elsewhere [22,26,28,34,38-40]. Table 7 summarizes the chemical descriptors calculated by DFT- theory. The optimized geometries of the reported inhibitors as well as Frontier molecule orbital (HOMO & LUMO) delocalization, and electron density map are shown in figure 8.
|
Table 7: Chemical descriptors of P2&P3 inhibitors. |
||
|
Chemical descriptors |
P2 |
P3 |
|
EHOMO, eV |
-0.2154 |
-0.2342 |
|
ELUMO, eV |
-0.0997 |
-0.0817 |
|
I, eV |
0.2154 |
0.2342 |
|
A, eV |
0.0997 |
0.0817 |
|
ΔE gap, eV |
0.1157 |
0.1525 |
|
χ |
0.1575 |
0.1580 |
|
η, eV |
0.0579 |
0.0762 |
|
σ, eV -1 |
17.2809 |
13.1177 |
|
μ |
-0.1575 |
-0.1580 |
|
w, eV |
0.2144 |
0.1636 |
|
e |
4.663100371 |
6.11107 |
|
ΔN |
59.1218 |
44.8759 |
|
ΔE Back-donation, eV |
-0.0145 |
-0.0191 |
The molecular distribution of the HOMO and LUMO orbitals are mostly localized on the hetero O and N atoms and aromatic rings containing hetero N atoms in the reported inhibitors. Consequently, the hetero O and N atoms are conjugated in the electron’s transferee during metal/inhibitors interactions. The molecular electrostatic potential (ESP) map has been characterized by different colors which indicate the electron density distribution through the inhibitor molecule [26]. Red colors are designated for negative electrostatic potential, while blue regions are related to positive ones [25]. Ö and N atoms contain lone pairs of electrons, so displayed as red regions possessing the most negative charges. Ö and N atoms are the negatively charged sites that give electrons to the Fe atoms to form a coordinate bond [29,41]. The -OH and Cl- have more positive charges and display dark blue regions. The white regions were assigned for zero electrostatic potential of the phenyl rings [25,26,42]. The stabilization of the HOMO and LUMO orbitals for the reported inhibitors reveals their electron-donating ability to the metallic surface [25]. By analyzing the chemical descriptors as displayed in table 7. The highest value of EHOMO (-0.2154 & -0.2342 eV) indicates the higher inhibition efficiency of the P2 and P3 inhibitors owing to their higher electron-donation ability to the Fe surface. The lower the ELUMO, the easier is the electron's acceptance from the (d) orbital of the Fe metal [38]. The lower energy gap (ΔELUMO-HOMO) in P2 inhibitor (0.1157 eV) rather than P3 inhibitor (0.1525 eV) indicate a good inhibition efficiency and relative chemical reactivity of P2 inhibitor towards the metallic surface, owing to the lower energy needed to remove the electron from the highest-energy occupied molecular orbital [29]. The lower ionization energy (0.2154 eV) of the P2 inhibitor assures its higher inhibition efficiency [25,43]. By screening the global softness and hardness values, P2 inhibitors exhibit the highest global softness (17.2809 eV) and the lowest global hardness (0.0579 eV) compared to P3 inhibitor so, it is evident to be an efficient corrosion inhibitor rather than a P3 inhibitor [44]. This assumption is based on the Lewis acid-base theorem which states that the metal (Fe) surface will interact with softer molecules faster than the harder molecules [25]. According to Sanderson’s electronegativity equalization principle [45,46], the lower electronegativity value of both P2 & P3 inhibitors ascertains its higher inhibition efficiency [44]. The results of electrophilicity indicate that reactive, and efficient nucleophile is characterized by a low value of electronic chemical potential (μ) and electrophilicity index () [38]. The fraction of electron transferred (ΔN) value confirms that the P2 inhibitor has a higher value of electron transfer (59.1218) so it exerts high inhibition efficiency attributed to the higher electron-donating ability to the metallic surface according to Lukovits’s study [38,47]. The electron flows from the molecule orbitals to the Fe surface until the chemical equilibrium is attained [25]. ΔE Back-donation was calculated relevant to the global hardness and revealed that back-donation is favored for P2 and P3 as a good inhibitor [44]. Since ΔE Back-donation < 0, so the electron-back-donation process is energetically favored, and the adsorption of the inhibitor molecule on the Fe surface is strengthened [25]. The efficiency of P2 and P3 for corrosion inhibition resort to the presence of oxygen and nitrogen heteroatoms with abundant π-electrons so adsorb efficiently on the metallic surface and withstand the corrosion [22,25]. The polar heteroatoms energize the inhibitor-metal cation adsorption interaction [25]. As a result, active binding sites on the Fe surface are overcrowded, so, the anodic/cathodic interactions diminished during the electrochemical process [25].
Conclusion
The corrosion inhibition performance of the synthesized cyanoacetamide derivatives was investigated in 1 mol HCl for mild steel through conducting experimental and computational methodologies. Based on the obtained results from Potentiodynamic polarization and electrochemical impedance measurement, the following aspects can be highlighted;
1. The investigated nonionic surfactant is an effective inhibitor for corrosion of carbon steel in oil well produced water.
2. The adsorption of the inhibitor molecules obeyed the Langmuir adsorption isotherm.
3. The values of the percentage inhibition efficiency obtained from potentiodynamic polarization and electrochemical impedance spectroscopy are in good agreement.
4. The potentiodynamic polarization curves indicated that the inhibitor molecules inhibit both anodic metal dissolution and also cathodic oxygen reduction so that the undertaken surfactant is classified as a mixed-type inhibitor.
5. The inhibition mechanism is attributed to the strong adsorption ability of the selected surfactant on the carbon steel surface, forming a good protective layer, which isolates the surface from the aggressive environment.
6. The produced good protective film on the carbon steel surface was confirmed using SEM and EDX techniques.
7. The data obtained from the experimental techniques are confirmed by theoretical data obtained from quantum chemical calculations.
8. The Monte Carlo simulation and DFT approach indicate the higher inhibition efficiency of P2 inhibitor rather than P3 inhibitor.
Abbreviations
|
EHOMO& ELUMO, eV |
Frontier molecular orbitals (FMO) energies |
|
I, eV |
Ionization potential |
|
A, eV |
Electron affinity |
|
ΔE gap, eV |
The energy bandgap |
|
χ |
Absolute electronegativity |
|
η, eV |
Global hardness |
|
σ, eV -1 |
Global softness |
|
w, eV |
Global electrophilicity index |
|
e |
Nucleophilicity |
|
μ |
Electronic chemical potential |
|
ΔN |
The fraction of electron transferred |
|
ΔE Back-donation, eV |
Total energy change |
Supplementary data
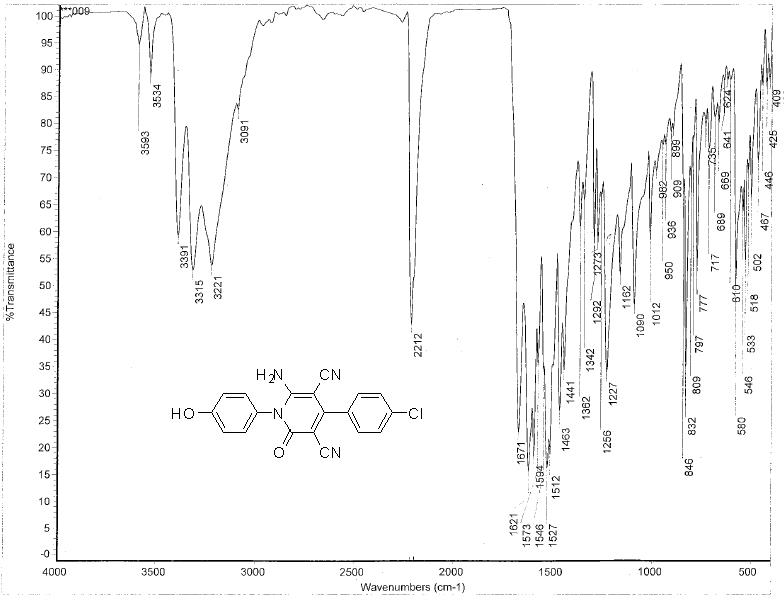
Figure S1: FT-IR spectrum of the Synthesized inhibitor P3.
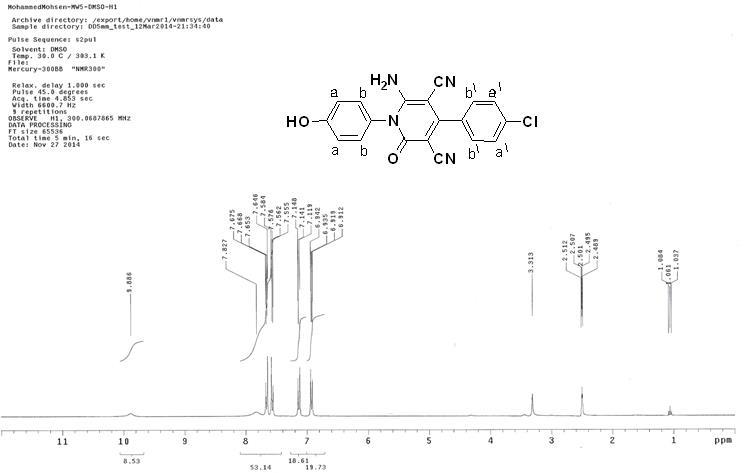
Figure S2: 1H NMR spectrum of the synthesized inhibitor P3.
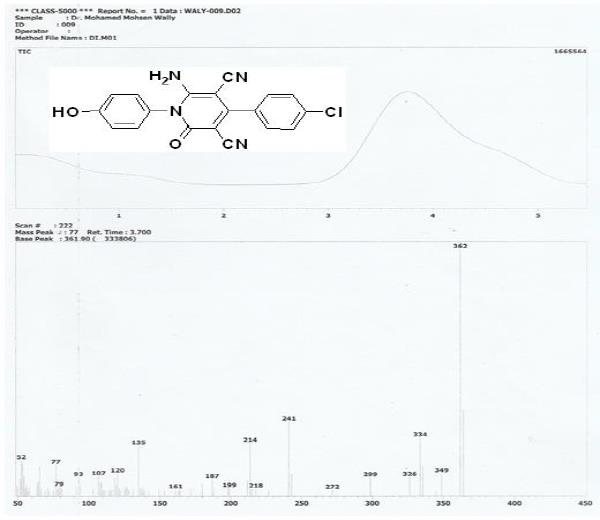
Figure S3: Mass spectroscopy of the synthesized inhibitor P3.
References
1. Fadda AA, Rabie R, Etman HA, et al. 2017. Synthesis of Thiazolinone, Aminopyrazole, Pyrazolopyrimidine, and Pyrazolotriazine Derivatives Starting from 1?Naphthyl?2?Cyanoacetamide. Chem. 54: 1015-1023. Doi.: https://doi.org/10.1002/jhet.2669
2. Fadda AA, Rabie R, Etman HA, et al, 2015. Res. 1-Naphthyl-2-cyanoacetamide in heterocyclic synthesis: synthesis and evaluation of the antimicrobial activity of some new pyridine, pyrimidine, and naphtho[2,1-b]oxazine derivatives. Chem Intermed. 41: 7883-7897. Doi: https://doi.org/10.1007/s11164-014-1864-6
3. Wang K, Herdtweck E, Do?mling A, 2011. Cyanoacetamides (IV): Versatile One-Pot Route to 2-Quinoline-3-carboxamides. ACS combinatorial science 14: 316-322. Doi: https://doi.org/10.1021/co3000133
4. Fadda AA, Rabie R. 2016. Cyanoacetylation of amines: Recent advances in preparation methods and their synthetic uses in the formation of biologically active compounds. Res Chem Intermed. 42: 771-811. Ref.: https://doi.org/10.1007/s11164-015-2055-9
5. Zhang X, Kang Q, Wang Y. 2018. Theoretical study of N-thiazolyl-2-cyanoacetamide derivatives as corrosion inhibitor for aluminum in alkaline environments. Computational and Theoretical Chemistry. 1131: 25-32.
6. Alafeefy AM, Alqasoumi SI, Ashour AE, et al. 2012. Quinazoline-tyrphostin as a new class of antitumor agents, molecular properties prediction, synthesis and biological testing. Eur J Med Chem. 53: 133-140. Ref.: https://pubmed.ncbi.nlm.nih.gov/22520152/ Doi: https://doi.org/10.1016/j.ejmech.2012.03.044
7. El-Hamouly WS, Amin KM, El-Assaly SA, et al. 2011. Synthesis and antitumor activity of some new 1,3,4-oxadiazole, pyrazole and pyrazolo[3,4-d]pyrimidine derivatives attached to 4-benzothiazol-2-yl phenyl moiety. Der Pharma Chemica. 3: 282-292.
8. Rajanarendar E, Reddy MN, Krishna SR, et al. 2012. 1-Naphthyl-2-cyanoacetamide in heterocyclic synthesis: synthesis and evaluation of the antimicrobial activity of some new pyridine, pyrimidine, and naphtho[2,1-b]oxazine derivatives. Eur J Med Chem. 55: 273-283.
9. Ismail MM, Ammar YA, El?Zahaby HS, et al. 2007. Synthesis of Novel 1?Pyrazolylpyridin?2?ones as Potential Anti?Inflammatory and Analgesic Agents. Archiv der Pharmazie: An International Journal Pharmaceutical and Medicinal Chemistry. 340: 476-482. Doi: https://doi.org/10.1002/ardp.200600197
10. Behbehani H, Ibrahim HM, Makhseed S, et al. 2012. 2-Aminothiophenes as building blocks in heterocyclic synthesis: Synthesis and antimicrobial evaluation of a new class of pyrido[1,2-a]thieno[3,2-e]pyrimidine, quinoline and pyridin-2-one derivatives. Eur J Med Chem. 52: 51-65. Doi: https://doi.org/10.1016/j.ejmech.2012.03.004
11. Behbehani H, Ibrahim HM, Makhseed S, et al. 2011. Applications of 2-arylhydrazononitriles in synthesis: Preparation of new indole containing 1,2,3-triazole, pyrazole and pyrazolo[1,5-a]pyrimidine derivatives and evaluation of their antimicrobial activities. Eur. J. Med. Chem. 46: 1813-1820. Doi: http://dx.doi.org/10.1016/j.ejmech.2011.02.040
12. Abu-Bakr SM, El-Shehry M, El-Telbani E, 2010. Synthesis and antimicrobial activity of new hetrocycles obtained using cyanoacetylation. Pharm Chem J. 44: 433-437. Doi: https://doi.org/10.1007/s11094-010-0485-7
13. El-Bayouki KA, Aly MM, Mohamed YA, et al. 2009. WJ Chem. 4: 161.
14. Kiselyov AS, Semenova M, Semenov VV. 2009. 3,4-Disubstituted isothiazoles: novel potent inhibitors of VEGF receptors 1 and 2. Bioorg Med Chem Lett. 19: 1195. Doi: https://doi.org/10.1016/j.bmcl.2008.12.078
15. Busch BB, Stevens WC, Martin R. 2004. Identification of a selective inverse agonist for the orphan nuclear receptor estrogen-related receptor alpha. J Med Chem. 47: 5593-5596. Ref.: https://pubmed.ncbi.nlm.nih.gov/15509154/ Doi: https://doi.org/10.1021/jm049334f
16. Fouda A, Eldesoky A, Mohamed FS, et al. 2017. Electrochemical and Quantum Chemical Investigations of some Cyanoacetamide Derivatives as Eco-Friendly Corrosion Inhibitors for Aluminum-Silicon Alloy in Acidic Solution. Int J Electrochem Sci. 12: 4134- 4149. https://doi.org/10.20964/2017.05.10
17. Fouda A, Megahed H, Younis T, Abd El-Salam S. 2014. Corrosion control of steel in HCl solutions by cyanoacetamide derivatives. Protection of Metals and Physical Chemistry of Surfaces. 50: 254-265. Doi: https://doi.org/10.1134/S2070205114020075
18. El-hoshoudy A, Mansour E, Desouky S. 2020. Experimental, computational and simulation oversight of silica-co-poly acrylates composite prepared by surfactant-stabilized emulsion for polymer flooding in unconsolidated sandstone reservoirs. J Mol Liq. 113082. Doi: https://doi.org/10.1016/j.molliq.2020.113082
19. El-hoshoudy A, Zaki E, Elsaeed S. 2020. Experimental and Monte Carlo simulation of palmitate-guar gum derivative as a novel flooding agent in the underground reservoir. J Mol Liq. 112502. Doi: https://doi.org/10.1016/j.molliq.2020.112502
20. El-hoshoudy A, Soliman F, Mansour E, et al. 2019. Experimental and theoretical investigation of quaternary ammonium-based deep eutectic solvent for secondary water flooding. J Mol Liq. 294: 111621. Doi: https://doi.org/10.1016/j.molliq.2019.111621
21. El-hoshoudy AN, Soliman FS, Mohamed D, 2020. Extractive desulfurization using choline chloride-based DES/molybdate nanofluids; Experimental and theoretical investigation. Journal of Molecular Liquids. 318: 114307. Doi: https://doi.org/10.1016/j.molliq.2020.114307
22. Dagdag O, Safi Z, Erramli H, et al. 2019. Anticorrosive property of heterocyclic based epoxy resins on carbon steel corrosion in acidic medium: Electrochemical, surface morphology, DFT and Monte Carlo simulation studies. J Mol Liq. 110977. Doi: https://doi.org/10.1016/j.molliq.2019.110977
23. Jawalkar S, Nataraj S, Raghu A, et al. 2008. Molecular dynamics simulations on the blends of poly(vinyl pyrrolidone) and poly(bisphenol-A-ether sulfone). Journal of Applied Polymer Science. 108: 3572-3576. https://doi.org/10.1002/app.28005
24. Raghu A, Gadaginamath G, Jawalkar S, et al. 2006. Synthesis, characterization, and molecular modeling studies of novel polyurethanes based on 2,2′?[ethane?1,2?diylbis(nitrilomethylylidene)]diphenol and 2,2′?[hexane?1,6?diylbis(nitrilomethylylidene)] diphenol hard segments†. J Polym Sci Part A: Polym. Chem. 44: 6032-6046. Doi: https://doi.org/10.1002/pola.21686
25. Obot I, Onyeachu IB, Wazzan N, et al. 2019. Theoretical and experimental investigation of two alkyl carboxylates as corrosion inhibitors for steel in acidic medium. J Mol Liq. 279: 190-207. Doi: https://doi.org/10.1016/j.molliq.2019.01.116
26. Kaya S, Tüzün B, Kaya C, et al. 2016. Determination of corrosion inhibition effects of amino acids: Quantum chemical and molecular dynamic simulation study. Journal of the Taiwan Institute of Chemical Engineers. 58: 528-535. Doi: https://doi.org/10.1016/j.jtice.2015.06.009
27. Murmu M, Saha SK, Bhaumick P, et al. 2020. Corrosion inhibition property of azomethine functionalized triazole derivatives in 1 mol L−1 HCl medium for mild steel: Experimental and theoretical exploration. J Mol Liq. 313: 113508. Doi: https://doi.org/10.1016/j.molliq.2020.113508
28. Negm N, Migahed M, Farag R, et al. 2018. High performance corrosion inhibition of novel tricationic surfactants on carbon steel in formation water: Electrochemical and computational evaluations. J Mol Liq. 262: 363-375. Doi: https://doi.org/10.1016/j.molliq.2018.04.092
29. Musa AY, Jalgham RT, Mohamad AB. 2012. Molecular dynamic and quantum chemical calculations for phthalazine derivatives as corrosion inhibitors of mild steel in 1 M HCl. Corros Sci. 56: 176-183. Doi: https://doi.org/10.1016/j.corsci.2011.12.005
30. Yadav A, Nishikata A, Tsuru T. 2004. Electrochemical impedance study on galvanized steel corrosion under cyclic wet–dry conditions-influence of time of wetness. Corros Sci. 46: 169-181. Doi: https://doi.org/10.1016/S0010-938X(03)00130-6
31. Khaled K. 2006. Experimental and theoretical study for corrosion inhibition of mild steel in hydrochloric acid solution by some new hydrazine carbodithioic acid derivatives. Appl Surf Sci. 252: 4120-4128. Doi: https://doi.org/10.1016/j.apsusc.2005.06.016
32. Rosen MJ, Kunjappu JT. 2015. Surfactants and interfacial phenomena. John Wiley & Sons.
33. Amin MA. 2006. Weight loss, polarization, electrochemical impedance spectroscopy, SEM and EDX studies of the corrosion inhibition of copper in aerated NaCl solutions. J Appl Electrochem. 36: 215-226. Doi: https://doi.org/10.1007/s10800-005-9055-1
34. Bedair M, Soliman S, Hegazy M, et al. 2019. Empirical and theoretical investigations on the corrosion inhibition characteristics of mild steel by three new Schiff base derivatives. J Adhes Sci Technol. 33: 1139-1168.
35. Khaled K, 2010. Experimental and molecular dynamics study on the inhibition performance of some nitrogen containing compounds for iron corrosion. Mater Chem Phys. 124: 760-767. Doi: https://doi.org/10.1016/j.matchemphys.2010.07.055
36. Khaled K. 2010. Electrochemical behavior of nickel in nitric acid and its corrosion inhibition using some thiosemicarbazone derivatives. Electrochim Acta. 55: 5375-5383. Doi: https://doi.org/10.1016/j.electacta.2010.04.079
37. Wang H, Wang X, Wang H, et al. 2007. DFT study of new bipyrazole derivatives and their potential activity as corrosion inhibitors. J Mol Model. 13: 147-153. Doi: https://doi.org/10.1007/s00894-006-0135-x
38. Gad EA, Al-Fahemi JH. 2015. Adsorpitivity and corrosion inhibtion performance of 2- (alkyloxy)-N, N, N-tris(2-hydroxyethyl)-2-oxoethanaminium chloride using DFT approach. Int J Sci Eng Res. 6: 570.
39. Verma C, Quraishi M, Ebenso EE, et al. 2018. Synthesis, Characterization, and Corrosion Inhibition Performance of 5-Aminopyrazole Carbonitriles Towards Mild Steel Acidic Corrosion. Journal of Bio-and Tribo-Corrosion. 4: 53. Doi: https://doi.org/10.1007/s40735-018-0174-8
40. Al-Fahemi JH, Abdallah M, Gad EA. 2016. Jahdaly, Experimental and theoretical approach studies for melatonin drug as safely corrosion inhibitors for carbon steel using DFT. J Mol Liq. 222: 1157. Doi: https://doi.org/10.1016/j.molliq.2016.07.085
41. Raghu A, Gadaginamath G, Jeong HM, et al. 2009. Synthesis and characterization of novel schiff base polyurethanes. J Appl Polym Sci. 113: 2747- 2754.
42. Raghu A, Gadaginamath G, Priya M, et al. 2008. Synthesis and characterization of novel polyurethanes based on N1,N4?bis[(4?hydroxyphenyl)methylene]succinohydrazide hard segment†. J Appl Polym Sci. 110: 2315-2320. https://doi.org/10.1002/app.27366
43. Gad EA, Azzam E, Halim SA. 2017. Theoretical approach for the performance of 4-mercapto-1-alkylpyridin-1-ium bromide as corrosion inhibitors using DFT. Egyptian journal of petroleum.
44. Abdallah M, Gad EA, Al-Fahemi JH, et al. 2018. Protection of Metals and Physical Chemistry of Surfaces. 54: 503.
45. Sanderson RT. 1983. Electronegativity and bond energy. J Am Chem Soc. 105: 2259.
46. Bratsch SG. 1984. Electronegativity equalization with Pauling units. J Chem Educ. 61: 588.
47. Lukovits I, Kalman E, Zucchi F, 2001. Corrosion Inhibitors-Correlation between Electronic Structure and Efficiency. Corrosion. 57: 3-8. Doi: https://doi.org/10.5006/1.3290328


