Indexing & Abstracting
Full Text
Research ArticleDOI Number : 10.36811/ijpsh.2022.110034Article Views : 0Article Downloads : 0
Changes in some physiological characteristics in the libyan strawberry -tree plant (arbutus pavarii l) in selected location of the green mountain (al -jabel al-akhdar) - libya
Ghazala Ahmad Hamaden Mansour1, Idress Hamed Attitalla2*, Shweta More3 and K.D. Ahire4
1Botany Department, Faculty of Art and Science, University of Benghazi, Al-Abyar Branch, Benghazi, Libya
2Dept. of Microbiology, Omar AL-MuKhtar University, Libiya
3YCMOU, Maharashtra India
4Dept. of Environmental Science, K.T.H.M. College, Nashik, Maharashtra, India
*Corresponding Author: Idress Hamed Attitalla, Dept. of Microbiology, Omar AL-MuKhtar University, Libiya; Email: idress.hamad@omu.edu.ly
Article Information
Aritcle Type: Research Article
Citation: Ghazala Ahmad Hamaden Mansour, Idress Hamed Attitalla, Shweta More, et al. 2022. Changes in some physiological characteristics in the libyan strawberry -tree plant (arbutus pavarii l) in selected location of the green mountain (al -jabel al-akhdar) - libya. Int J Plant Sci Hor. 4: 10-32.
Copyright: This is an open-access article distributed under the terms of the Creative Commons Attribution License, which permits unrestricted use, distribution, and reproduction in any medium, provided the original author and source are credited. Copyright © 2022; Ghazala Ahmad Hamaden Mansour
Publication history:
Received date: 10 May, 2022Accepted date: 24 May, 2022
Published date: 26 May, 2022
Abstract
The present research was carried out to study changes in some physiological characteristics in the Libyan Strawberry -Tree plant (Arbutus Peveril) in selected location of the Green Mountain (Al -Jabel Al-Akhdar) - Libya. The plant material was selected using random sampling technique from the EL-Gabal EL-Akhdar area (Assunta area). Chemical tests and assays were carried out to determine the stored essential oils, total flavonoids content and total phenolic content. The photosynthetic pigments and microbial number were estimated as well. The study also made use of gas chromatography and mass spectrophotometric methods.
Keywords: Arbutus parawai L; Green Mountain, Libya; Essential oils; photosynthetic pigments, Phenolic compounds
Introduction
Arbutus Pahari Pump. (Ericaceae) is one of the endemic species in Libya and it distributes naturally as wild plant in El-Gabel El-Akhdar area, which characterized with Mediterranean climatic conditions [1-3] (Ehattesaht 2009; Ehattesaht et al 2009; and Ela bidi and Ehattesaht 2017). It is-
? Evergreen shrub, 1.5 to 3 m tall
? Reddish brown peeling bark
? Flowering season [late October to February]
? Flowers are a good source of nectar for bees
? Used for folk medicinal purposes
? Drought tolerant
The fruit takes around 8 months to ripen, and they are spherical and warty, and turn from yellow to orange to scarlet as the autumn progresses (figure 1). There are a number of factors for the difficulty of germination and growth of these plants naturally in the wild land. Drop-in rate of rainfall annually it is the most important environmental factor which has made the wild lands drier and decreased significantly seeds germination [3] (Elmaghrabi at al. 2017). In addition, overgrazing and the use of lumber as firewood and also expansion of new farms, which contributed of deterioration sharply of edible and medical wild plant resources which led these species to endanger [3] (Elmaghrabi et al 2017). There were about six species of Arbutus grows spontaneously around the Mediterranean basin. The essential oil of Haplophyllum tuberculate was reported by [4] (Al-Readily et al, 2014) which prepared by hydro distillation of the fresh flowering aerial parts of the plant collected from wild types. The oil was subsequently analysed by GC and GC-MS. Thirty-seven compounds, accounting for 96.4 % of the oil composition were identified in this study [4] (Al-Rehaily et al, 2014). The antimicrobial and activity of the essential oil was also evaluated against various human pathogens, where a relatively low inhibitory range was observed. The purpose of this study was to develop an efficient protocol for in vitro propagation of endanger edible strawberry tree (Arbutus pavarii) and medical plant Haplophyllum tuberculatum. This work, basedonHPLC-DAD- MS/Misanalysis strawberry tree (Arbutus unedo L.) honeys, previously selected by sensory evaluation and melissopalynological analysis, showed that, in addition to the above-mentioned acid, there were other high levels of substances useful for the botanical classification of this unfloral honey. The results clearly demonstrate that a promising level of chemically-determined antioxidant activity of a plant extract is not necessarily correlated with biological significance, as assessed by the effect of A. unedo fruit in a neurodegeneration cell model.
Objectives
• Identify some of the physiological and morphological characteristics of in the developing Arbutus Pavarii in the Jabal ALAkhdar-Eco-region-Libya area.
• Determine the chemical composition (essential oil contents and antioxidant activity) of the Arbutus Pavarii.
Materials and methods
Materials
Plant material: The samples of Arbutus pavarii were collected from the EL-Gabal EL-Akhdar area (Asulntah area) and then three random plants were chosen that included (Sample1= plant intact and naturally grown, sample2= plant grown almost normal and sample 3= plant not grown naturally). All samples were collected from the same location. Chemicals: 1, 1-Diphenylpicrylhydrazyl (DPPH?), methanol, ethanol and acetone were supplied by Sigma and Merck company. Ascorbic acid, Folin-Ciocalteu reagent, ferric chloride, potassium ferricyanide, monobasic dihydrogen phosphate, dibasic nonhydrogen phosphate, trichloro acetic acid, sodium carbonate, anhydrous sodium sulphate and pyrogallol were obtained from the biochemistry laboratory of Chemistry department-Benghazi University.
Methods
Extraction of essential oil from leaves of Arbutuspavarii (sample 1, sample 2 and sample 3): The dry powdered leaves of Juniperus Phoenicia(500g) were subjected to hydro distillation using Clevenger apparatus. The isolation of volatile oils was completed within 6 hours (Clevenger, 1928). Store essential oils: The oil samples were stored at 7°C in dark air-tight containers after drying over anhydrous sodium sulphate and filtered before injecting to GC-MS analysis.
Oil analysis: The oil samples extracted from leaves of Arbutus parianware subjected to the following tests:
• Gas chromatography/ Mass spectra: Thermos Scientific, Trace GC Ultra & ISQ Single Quadruple MS, DB-5 bonded-phase fused-silica capillary column was used in for GC/MS analysis of essential oils. This experiment has been conducted in the central laboratory at Cairo University-Egypt.
• Antioxidant activities assays and quantitative analysis: All of these experimental assays have been conducted in biochemistry laboratory at Benghazi University.
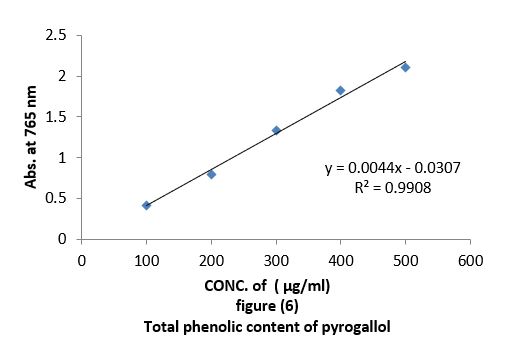
• Total phenolic content (TPC): Total concentration of phenolic compound in all oil extracts obtained from leaves of Arbutus pavariiwas estimated using the colorimetric method based on Folin-Ciocalteu reagent (Sawsan et al. 2010). 0.05 ml of the oils at different concentrations "100,200,300,400,500 µg/ml" were mixed separately with 0.05 ml of Folin-Ciocalteu reagent. Then 0.5 ml of 15% sodium carbonate solution was added to the mixture and then the adjusted to 1 ml with 0.4 ml of distilled water. The reaction was allowed to stand for 10 min, after which the absorbance was recorded at 725 nm by UV-visible spectrophotometer. Quantification was done with respect to standard calibration curve of pyrogallol. The results were expressed as pyrogallol "µg/ml" Figure (6). Estimation of the phenolic compounds was carried out in triplicates. The results were mean values (standard deviations).
|
Table 1: Total phenolic content (TPC) of pyrogallol.
|
|
|
Concentration of Pyrogallol " µg/ml " |
Mean (Standard Deviation)
|
|
100 |
0.410 ( 0.032) |
|
200 |
0.799 (0.0220) |
|
300 |
1.333 (0.0045) |
|
400 |
1.828 (0.0117) |
|
500 |
2.105 (0.0225) |
Total flavonoids content (TFC)
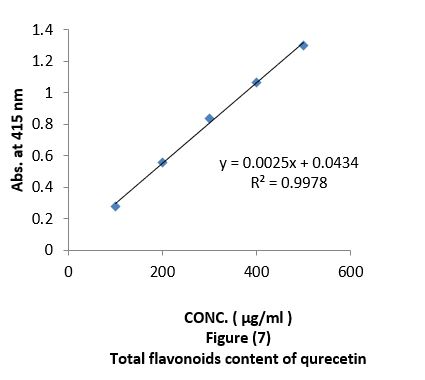
Aluminium chloride colorimetric method was used for determination of total flavonoids (Chang et al., 2002). 2 ml of different concentration "100, 200, 300, 400, 500 µg/ml " of oil extracts mixed with 0.1ml of 10% aluminium chloride, 0.1 ml of 1 M potassium acetate and 2.8 ml of distilled water. It was kept at room temperature for 30 min; the absorbance of the reaction mixture was measured at 415 nm with a UV-visible spectrophotometer. The calibration curve was obtained by preparing different quercetin solutions in methanol at concentrations "100 to 500 µg/ml" Figure (7).
|
Table 2: Total flavonoids content of quercetin. |
|
|
Concentration of quercetin " µg/ml " |
Mean (Standard Deviation)
|
|
100 |
0.279(0.092) |
|
200 |
0.560 (0.035) |
|
300 |
0.834 (0.003) |
|
400 |
1.066 (0.009) |
|
500 |
1.300 (0.006) |
Reducing power assay (RPA)
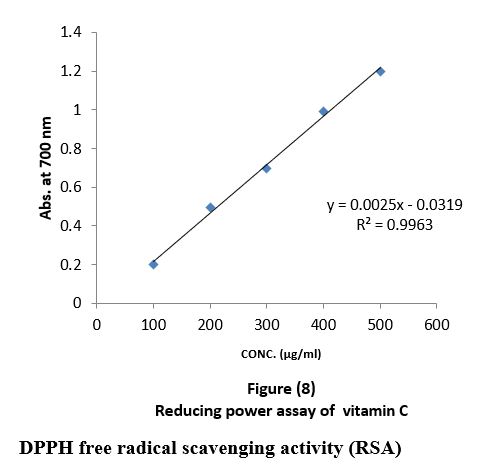
The reducing power was determined according to (Naznin and Hasan, 2009). 2ml of the all-oil extracts with different concentrations "100,200,300,400,500µg/ml" were mixed with 2.5 ml phosphate buffer (0.2 M, pH 6.6) and 2.5 ml potassium ferricyanide then mixture was incubated in water bath at 50 C0 for 20 minutes and 2.5 ml of trichloroacetic acid was added to the mixture which was then centrifuged at 3000 rpm for 10 minutes. Finally, 2.5 ml of the supernatant was mixed with 2.5 ml of distilled water and 1 ml FeCl3, substances, which have reduction potential react with potassium ferricyanide (Fe3+) to form potassium ferricyanide (Fe2+), which then reacts with ferric chloride to form ferric ferrous complex that has an absorption maximum at 700nm by UV-Visible spectrophotometer. Quantification was done with respect to standard calibration curve of ascorbic acid the results were expressed as ascorbic acid "µg/ml" Figure (8).
![]()
|
Table 3: Reducing power assay of vitamin C. |
|
|
Concentration of vitamin C " µg/ml " |
Mean (Standard Deviation) |
|
100 |
0.201 (0.0280) |
|
200 |
0.495 (0.0350) |
|
300 |
0.697 (0.0087) |
|
400 |
0.992 (0.0727) |
|
500 |
1.201 (0.0305) |
DPPH free radical scavenging activity (RSA)
The antioxidant activity of all oil extracts was measured in terms of hydrogen donating or radical-scavenging ability using the stable DPPH ?method as modified by (Popovich and Kostya 2003). The reaction mixture containing 2 ml of all extracts at different concentrations "100,200,300,400,500µg/ml" and 2ml of DPPH? (0.2mM) was vigorously shaken and incubated in darkness at room temperature for 30 minutes. When the DPPH? reacted with an antioxidant compound in oil that can donate hydrogen, it was reduced and resulting in decrease of absorbance at 517nm using UV-visible spectrophotometer, and the mean values were obtained from triplicate experiments. The percentage of the remaining DPPH? was plotted against the sample concentration. A lower value indicates greater antioxidant activity. Radical scavenging activity was expressed as percent ages of inhibition and was calculated using the following formula:-
%DPPH "RSA" = [Abs. of Control – Abs. of Sample / Abs. of Control] x 100.
Growth characteristics of (Arbutuspavarii)
The study samples were divided into lots of different trees, depending on the appearance of exterior of the tree; three replicates in each tree were made to find out the quantitative and morphological differences.
Estimation of photosynthetic pigments
The photosynthetic pigments were extracted from a known fresh weight of leaves in 85% aqueous acetone to a certain concentration for spectrophotometric measurements. The photosynthetic pigments (chlorophyll a, b and carotenoids) were determined by, spectrophotometric method as described by [5] Metzner et al. (1965). The pigments extract was measured against a blank of pure 85% aqueous acetone at three wavelengths of 452.5, 644 and 663 nm. Taking into consideration the dilution factor, it was possible to determine the concentration of pigment fractions (chl. a, b and carotenoids) as mg/ml using following equations:
Chlorophyll a = 10.3 E663 – 0.918 E644 = mg/ml
Chlorophyll b = 19.7 E644 – 3.87 E663 = mg/ml
Carotenoids = 4.2 E452.5  = mg/ml
Finally, these pigment fractions were calculated as mg/g fresh matter.
The Estimation of microbial number
Nutrient Agar medium: 23 g of nutrient agar medium were suspended in 1-liter ml distilled water and then heat to boiling to dissolve the medium completely. It was sterilized by autoclaving at 15 lbs pressure (121?C) for 15 min.
Sample preparation
Plant: Leaves (brown and green) were collected from Arbutus pavarii. 2 grams of each part was put in a test tube containing 8 ml of distilled water and Shaked for 30 seconds. 1 ml of sample was put in a petri dish and then poured by nutrient agar medium under sterile conditions and incubated at 37.5°C for three days. Total number of microbial colonies of each plate was estimated.
Soil: Two samples were collected from sifted soil. 1 gram of each sample from different sites (under the sieve and above the sieve) was added to test tube containing 9 ml of distilled water and Shaked for 30 seconds. 1 ml of each sample was put in a petri dish and then set up the nutrient agar medium incubated at 37.5 °C for three days. Total number of microbial colonies of each plate was estimated.
Pure Culture: A single bacterial colony from each mixed culture was taken by loop, streaked on nutrient agar medium, and incubated at 37.5 ° C for three days.
Gram stain: Differential staining (Gram stain) was carried out to confirm that the bacteria were gram negative and rode shaped. Smears from single colony bacteria grown on EMB at 37 °C and 44.5°C were prepared and covered by primary stain (Crystal violet) for 1 min and then Mordant (Iodine) for 1 min to made CV-I complex after that decolorized agent (70% ethanol) was washed the slide to remove the CV-I complex in the thin layer of peptidoglycan of gram-negative bacteria. Wall. Drops of counter stain (safranin)were added for a half minute. was the slide then washed in the distilled water and dried by filter paper after that examined by microscope using an oil immuration lens. In summary, gram-positive cells retain the dye and remain purple, Gram-negative cells did not retain the dye; they were colourless until counterstained with a red dye (pink cells).
Endospore staining: A film was made on a clean slide by emulsifying part of a colony in loopful of distilled water. The film was then air-dried and stained with malachite green for 4-5 min, using a flame. The smear was rinsed rapidly with water and stained with safranin solution for 30 sec. The slide was washed with water and allowed to dry. On microscopic examination the endospores appeared green and the cells were pink (Abualdahab and Gorani, 1983).
Motility test: The test was used to distinguish between motile and non-motile bacteria, using the hanging-drop preparation. First a little oil immersion was placed around the edge of the slide, then with a wire loop a small loopful of the culture was transferred to a clean dry covered slip. After that, the cover slide was inverted over the cover slip, so that the drop was in the centre of the cavity and the slide was pressed down gently but slimly so that the oil seals the cover slip in position.
The slide was inverted quickly and smoothly and the drop of culture was placed in the form of the hanging-drop, and the preparation was examined quickly. It is necessary to distinguish between Brownian movement (a continuous agitation of very small particle suspended in a fluid which is called unbalanced impacts with molecules of the surrounding fluid) or drift in one direction caused by the slide being slightly tilted and true motility (Abualdahab and Gorani, 1983).
Result and Discussion
Antioxidant evaluation of essential oils extracted from leaves of Arbutus pavarii Pump. (Ericaceae). The antioxidant activities of essential oils extracted of three samples from leaves of Arbutus pavarii Pump. (Ericaceae)growing in Al-Jabal Al Akhdar were evaluated by: Total phenolic content (TPC): Figure (9) show the total phenolic content found in essential oils where the essential oil of sample number (1) contained high total phenolic content, the results expressed according to pyrogallol as phenolic compound in figure (6). Total flavonoids content (TFC): The results obtained in this study as shown in figure (10) indicated that the essential oil of healthy sample contains high amounts of flavonoids compounds as compared with the quercetin in figure (7) which was used as standard.
Reducing power assay (RPA): As shown in figure (11) the reducing power assay of essential oil of sample 1and sample 2 exhibits higher reducing activity than the ascorbic acid. The DPPH? radical scavenging activity: The result of the DPPH? radical scavenging activity of essential oil is shown in figure (12), this result compared with the well-known antioxidant ascorbic acid where the percent of the inhibition is 97% at 500 µg/ml of the essential oil of sample 1 and 92% at 500 µg/ml of the essential oil of sample 2, while the percent of the inhibition is 38% at 500 µg/ml of the essential oil sample 3.
|
Table 4: Total phenolic content (TPC) of essential oils extracted of three samples from leaves Arbutus pavarii (Sample1= plant intact naturally grow, sample2= plant growth almost normal, sample 3= No plant grows naturally) and % variation from the corresponding control (pyrogallol as standard). |
|||||||
|
Concentration " µg/ml"
|
Mean phenolic content (Standard Deviation) |
||||||
|
Pyrogallol |
Sample1 |
% var. |
Sample2 |
% var. |
Sample3 |
% var. |
|
|
100 (1) |
0.410 ( 0.032) |
0.711(0.03) * |
73.4↑ |
0.699 (0.05) * |
70.5↑ |
0.025 (0.0162) *** |
97.5↓ |
|
200 |
0.799 (0.0220) |
0.799 (0. 01)† |
Zero |
0.782 (0.011) † |
2.13↓ |
0.085 (0.020) ** |
89.4↓ |
|
300 |
1.333 (0.0045) |
1.435 (0.02) † |
7.65↑ |
0.988 (0.002) * |
31.2↓ |
0.222 (0.022) ** |
84.5↓ |
|
400 |
1.828 (0.0117) |
1.78 (0.01) † |
2.63↓ |
1.56 (0.016) † |
12.4↓ |
0.754 (0.036) * |
57.6↓ |
|
500 |
2.105 (0.0225) |
2.69(0.07) † |
27.8↑ |
2.21 (0.009) † |
17.8↓ |
1.061 (0.037) ** |
60.6↓ |
|
† Insignificant difference from the corresponding control at P > 0.1 * Significant difference from the corresponding control at P < 0.05 * * Highly sig. difference from the corresponding control at P < 0.01 *** Very highly sig. difference from the corresponding control at P < 0.001 ↓ Decrease ↑ Increase. |
|||||||
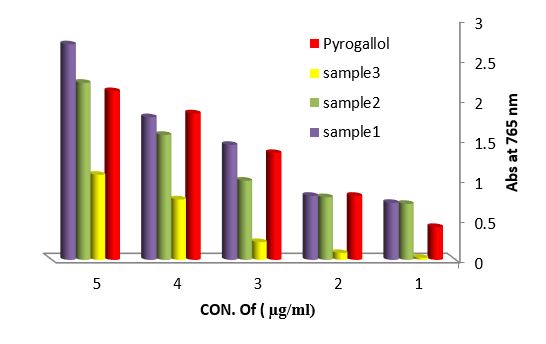
Figure 9: Total phenolic content (TPC) of essential oils extracted from leaves Arbutus paravian Pyrogallol as phenolic compound.
|
Table 5: Total flavonoids content essential oils extracted of three samples from leaves Arbutus pavarii (Sample1= plant intact naturally grow, sample2= plant growth almost normal, sample 3= No plant grows naturally) and % variation from the corresponding control (quercetin as standard). |
|||||||
|
Concentration " µg/ml" |
Mean phenolic content (Standard Deviation) |
||||||
|
quercetin |
Sample1 |
% var. |
Sample2 |
% var. |
Sample3 |
% var. |
|
|
100 |
0.279 (0.092) |
0.297 (0.032) † |
6.45↑ |
0.276 (0.002) † |
1.07↓ |
0.0845 (0.055) ** |
69.7↓ |
|
200 |
0.560 (0.035) |
0.497 (0.011) † |
11.25↓ |
0.375 (0.001) * |
33.0↓ |
0.095 (0.045) ** |
83.0↓ |
|
300 |
0.834 (0.003) |
0.664 (0.002) † |
20.4 ↓ |
0.609 (0.008) † |
27.0↓ |
0.141 (0.075) ** |
83.1↓ |
|
400 |
1.066 (0.009) |
0.820 (0.090) † |
18 ↓ |
0.869 (0.003) † |
18.4↓ |
0.423 (0.071) ** |
60.3↓ |
|
500 |
1.300 (0.006) |
1.690 (0.011) * |
30 ↑ |
1.340 (0.001) † |
3.08↑ |
0.866 (0.085) * |
33.4↓ |
|
Insignificant difference from the corresponding control at P > 0.1 * Significant difference from the corresponding control at P < 0.05 * * Highly sig. difference from the corresponding control at P < 0.01 *** Very highly sig. difference from the corresponding control at P < 0.001 ↓ Decrease ↑ Increase. |
|||||||
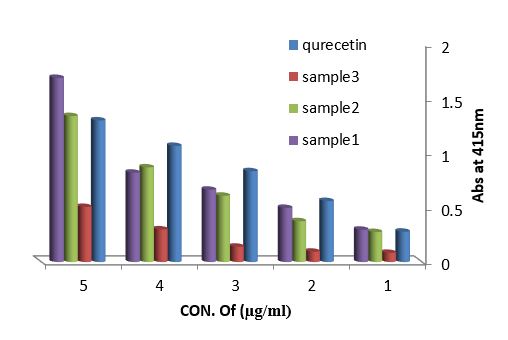
Figure 10: Total flavonoids content of essential oils extracted from leaves Arbutus pavarii and quercetin as flavonoid compound.
|
Table 6: Reducing power assay essential oils extracted of three samples from leaves Arbutus pavarii (Sample1= plant intact naturally grow, sample2= plant growth almost normal, sample 3= No plant grows naturally) and % variation from the corresponding control (vitamin C). |
|||||||
|
Concentration " µg/ml" |
Mean phenolic content (Standard Deviation) |
||||||
|
Vitamin C |
Sample1 |
% var. |
Sample2 |
% var. |
Sample3 |
% var. |
|
|
100 |
0.201 (0.0280) |
0.503 (0.0448) *** |
150.3↑ |
0.564 (0.07) *** |
180.6↑ |
0.044 (0.006) ** |
78.1↓ |
|
200 |
0.495 (0.0350) |
0.875(0.0965) ** |
76.8↑ |
0.871 (0.0)** |
75.9↑ |
0.104 ( 0.002)** |
79↓ |
|
300 |
0.697 (0.0087) |
1.293 (0.0471) ** |
85.5↑ |
1.321 (0.003) ** |
89.5↑ |
0.432 (0.005) * |
38.0↓ |
|
400 |
0.992 (0.0727) |
1.563 (0.0266) * |
57.6↑ |
1.899 (0.01) *** |
91.4↑ |
0.902 (0.016) † |
9.07↓ |
|
500 |
1.201 (0.0305) |
2.339 (0.0401)*** |
94.8↑ |
2.486 (0.01)*** |
107.0↑ |
1.052 (2.965) † |
12.41↓ |
|
† Insignificant difference from the corresponding control at P > 0.1 * Significant difference from the corresponding control at P < 0.05 * * Highly sig. difference from the corresponding control at P < 0.01 *** Very highly sig. difference from the corresponding control at P < 0.001 ↓ Decrease ↑ Increase. |
|||||||
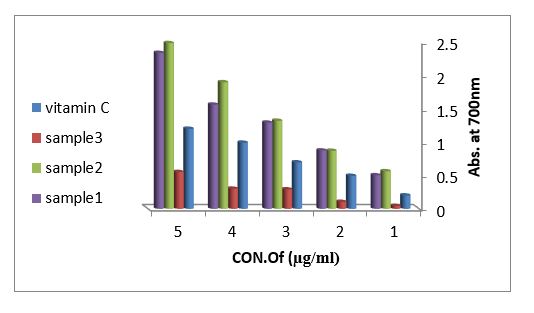
Figure 11: Reducing power assay of methanol, ethanol and acetone extracted from leaves Arbutus pavarii and vitamin C.
|
Table 7: DPPH radical scavenging activity of vitamin C, and essential oils extracted of three samples from leaves Arbutus pavariiaccording to % inhibition. |
|||||||
|
Concentration " µg/ml" |
Percent of inhibition (%) |
||||||
|
vitamin C |
Sample1 |
% var. |
Sample2 |
% var. |
Sample3 |
% var. |
|
|
100 |
92.3% |
57% * |
38.2↓ |
39% * |
57.7↓ |
11% * * |
88.1↓ |
|
200 |
93.8% |
79% † |
15.8↓ |
59% * |
37.1↓ |
19% * * |
79.7↓ |
|
300 |
95.1% |
85% † |
10.6↓ |
75% † |
21.1↓ |
27% * * |
71.6↓ |
|
400 |
95.8% |
89% † |
7.1↓ |
87% † |
9.19↓ |
33% * * |
65.6↓ |
|
500 |
96.7% |
97% † |
0.31↑ |
90% † |
6.93↓ |
38% * * |
60.7↓ |
|
Insignificant difference from the corresponding control at P > 0.1 * Significant difference from the corresponding control at P < 0.05 * * Highly sig. difference from the corresponding control at P < 0.01 *** Very highly sig. difference from the corresponding control at P < 0.001 ↓ Decrease ↑ Increase. |
|||||||
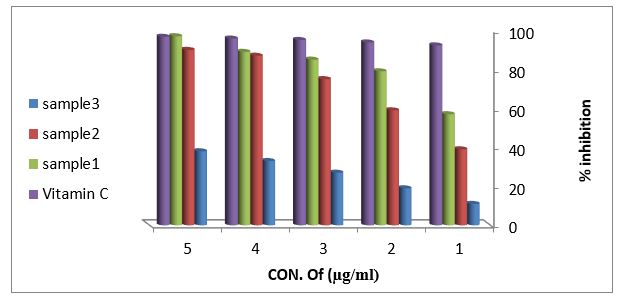
Figure 12: DPPH radical scavenging activity of vitamin C and essential oils extracted from leaves Arbutus pavariiaccording to % inhibition.
The GC-MS analysis of the essential oils extracted from leaves Arbutus pavarii
The retention time of the different compounds in the essential oils of Arbutus pupariate presented in Table 8. Thirty-four volatile compounds, representing 88.29% of the total oil composition in sample 1, were identified in the leaf’s oils (Table 8). Monoterpene hydrocarbons were found to be the major group of compounds. The most abundant component found in the leaf oil was α pinene (20.85%) followed by Germacrene D (16.49%), while α pinene and Germacrene D in sample 2 and sample 3were (12.45%,3.09%) and (9.19% ,1.054%) respectively. Surprisingly, there were decrease of these compounds in the sample diseased (table 8).
|
Table 8: The main components of essential oils of Arbutus pavarii. leaves collected from Al-Jabal Al Akhdar area (A sultan). *Rt: Retention time obtained by chromatogram. Sample1= plant intact naturally grow, sample2= plant growth almost normal and sample 3= No plant grows naturally. |
||||
|
Constituents |
Area % |
*Rt (min)
|
||
|
sample 1 |
Sample 2
|
Sample 3
|
||
|
α –pinene |
20.85 |
12.45 |
3.09 |
4.16 |
|
β –myrcene |
1.36 |
0.23 |
- |
5.06 |
|
Terpinolene |
0.07 |
- |
- |
5.26 |
|
β –phellandrene |
3.84 |
1.79 |
0.02 |
5.91 |
|
Trans-Caryophyllene |
5.44 |
5.00 |
2.087 |
14.66 |
|
4,7,10-Cycloundecatriene,1,1,4,8 tetramethyl-, cis, cis,cis |
5.31 |
4.13 |
0.12 |
15.37 |
|
Germacrene D |
16.49 |
9.19 |
1.054 |
16.05 |
|
Germacrene B |
2.73 |
1.72 |
- |
17.46 |
|
α – cedrol |
0.36 |
- |
- |
18.27 |
|
+. alpha. -longipinnate |
2.98 |
2.082 |
0.471 |
18.08 |
|
Naphthalene,1,2,3,4,4a,5,6,8a, - octahydro-7-methl-4-methylene-1- (1-methylethyl)- (1. alpha,4a.alpha.,8a.alpha) |
5.22 |
2.011 |
0.57 |
16.23 |
|
Camphene |
0.29 |
- |
- |
4.32 |
|
β-pinene |
0.49 |
- |
- |
4.81 |
|
1-phellandrene |
0.39 |
- |
- |
5.33 |
|
delta.3-carene |
0.40 |
- |
- |
5.46 |
|
α – terpinolene |
0.23 |
- |
- |
7.10 |
|
Terpinolene |
5.13 |
5.13 |
2.093 |
13.11 |
|
Linalool |
0.47 |
- |
- |
7.37 |
|
Citronellol |
0.63 |
- |
- |
10.30 |
|
α-cubebene |
0.39 |
- |
- |
13.60 |
|
β-bourbonene |
0.22 |
- |
- |
13.80 |
|
β-elemene |
0.93 |
- |
- |
13.94 |
|
Widdrene |
1.24 |
0.53 |
- |
14.83 |
|
α-gurjunene |
0.35 |
- |
- |
16.40 |
|
Zingiberene |
0.43 |
- |
- |
16.92 |
|
delta. -cadinene |
5.63 |
5.00 |
3.73 |
16.81 |
|
α-muurolene |
0.43 |
- |
- |
17.01 |
|
α-calacorene |
0.24 |
- |
- |
17.10 |
|
Elemol |
0.61 |
- |
- |
17.28 |
|
caryophyllene oxide |
2.06 |
1.890 |
0.281 |
17.95 |
|
Fonenol |
0.36 |
- |
- |
18.58 |
|
α-ylangene |
1.33 |
0.072 |
- |
19.03 |
|
β- selinene |
0.30 |
0.30 |
0.30 |
19.54 |
|
vulgarol B |
1.09 |
0.873 |
- |
19.88 |
1. The results of morphological and growth characteristics are given in table (9). From this table, the sample number (1) reflected the highest mean value of plant height and stem diameter. They were 222.67 cm and 16.42 cm, respectively.
|
Table 9: Growth in term of plant height (cm), stem diameter (cm) and leaf dry weight (mg) of Arbutus paver. in EL-Gabal EL-Akhdar area.
|
||||||
|
Leaf dry weight (mg) |
Stem diameter (cm) |
Plant height (cm) |
Sample Name |
|||
|
(SD) |
Mean |
(SD) |
Mean |
(SD) |
Mean |
|
|
(0.19) |
3.0234 |
(5.90) |
16.42 |
(21.35) |
222.67 |
Healthy sample |
|
(0.23) |
3.2058 |
(3.14) |
11.22 |
(17.93) |
216.55 |
Semi healthy sample |
|
(0.11) |
3.8240 |
(2.05) |
9.89 |
(23.47) |
214.23 |
Sample sick |
2. The results obtained in this study as shown in table (10) indicate that the healthy sample contain high amount of chlorophyll A, chlorophyll B and carotenoids as compared with the semi healthy sample and Sample disease.
|
Table 10: Estimation of photosynthetic pigments of Arbutus pavarii leaves in EL-Gabal EL-Akhdar area. |
|||
|
Sample |
Chlorophyll A (mg/ml)
|
Chlorophyll B (mg/ml)
|
Carotenoids (mg/ml)
|
|
Healthy sample |
5.7708 |
4.894 |
6.323 |
|
Semi healthy sample |
5.670 |
4.721 |
5.126 |
|
Sample sick |
4.346 |
2.915 |
3.503 |

Figure 13: Estimation of photosynthetic pigments of Arbutus pavarii. leaves in EL-Gabal EL-Ahkda area.
3. As shown in Figure (14) decreased the number of bacteria in the sub- branches of Semi- healthy sample but increased the number of bacteria in diseased sample. The number of bacteria in the sample healthy at the main branch of the highest less than the bottom, but in the semi-healthy sample, the number of bacteria from the top down and more of them there are more in the centre, while in diseased sample, the number of bacteria is too much and this shown in Figure (15). In addition, the number of bacteria in lichens the number of bacteria in three samples and an equal number was more than 300, as shown in the Figure (16). Through our results was observed that the number of bacteria in the green leaves of the sample healthy sample more than semi-healthy sample, as shown in Figure (17), while the number of bacteria in the brown leaves in all samples were large Figure (18). Figure (19) indicated that the number of bacteria taken of selected locations of Arbutus pavarii tree in an environment actinomycetes were a few specific sites, but the number of bacteria is high in lichens and green leaves and soil.
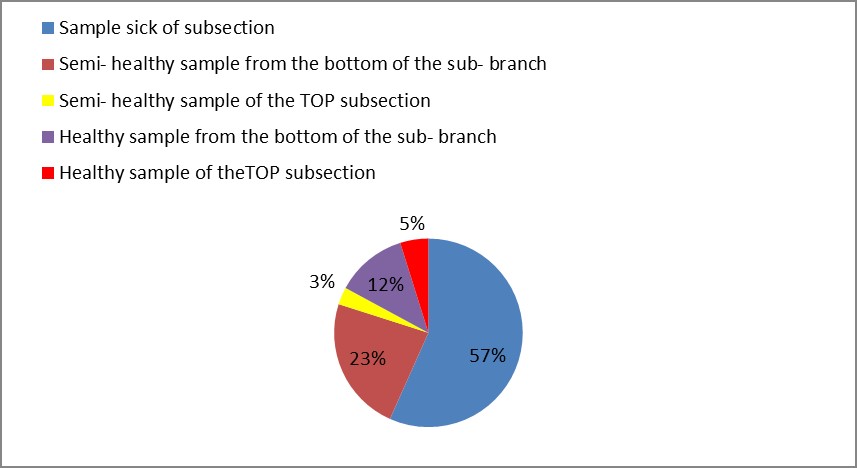
Figure 14: The number of bacteria on the sub- branches in Arbutus pavarii.
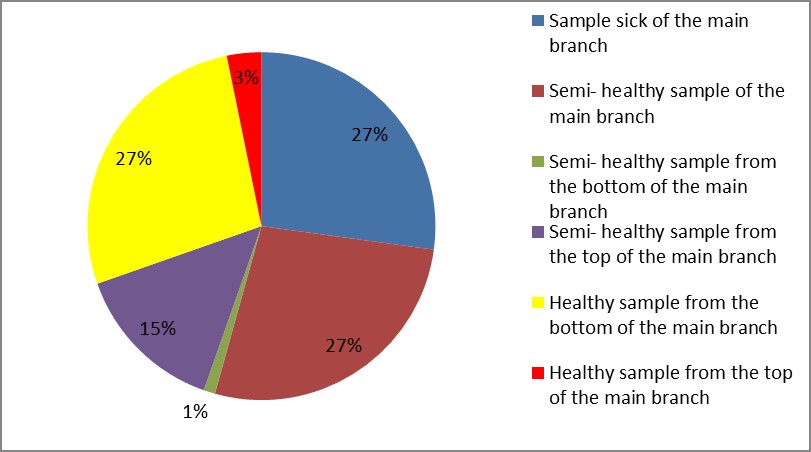
Figure 15: The number of bacteria on the main branch in Arbutus pavarii.
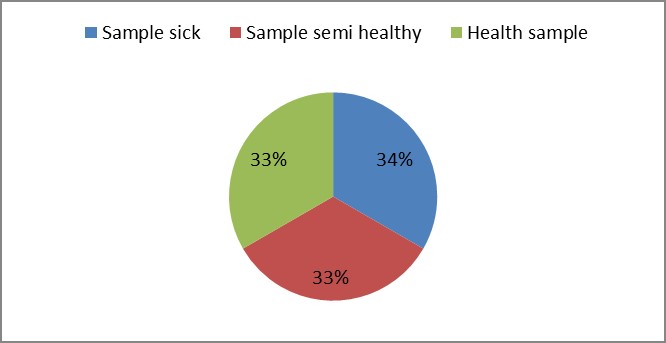
Figure 16: The number of bacteria on lichens in Arbutus pavarii plant.
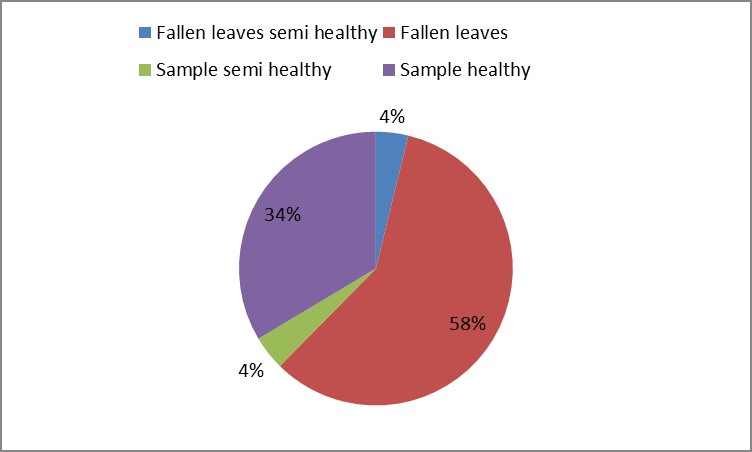
Figure 17: The number of bacteria on green leaves in Arbutus participant.
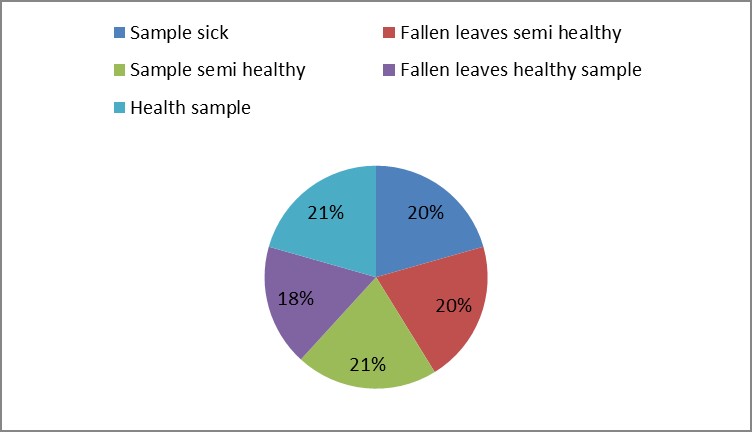
Figure 18: The number of bacteria on brown leaves in Arbutus pavarii plant.
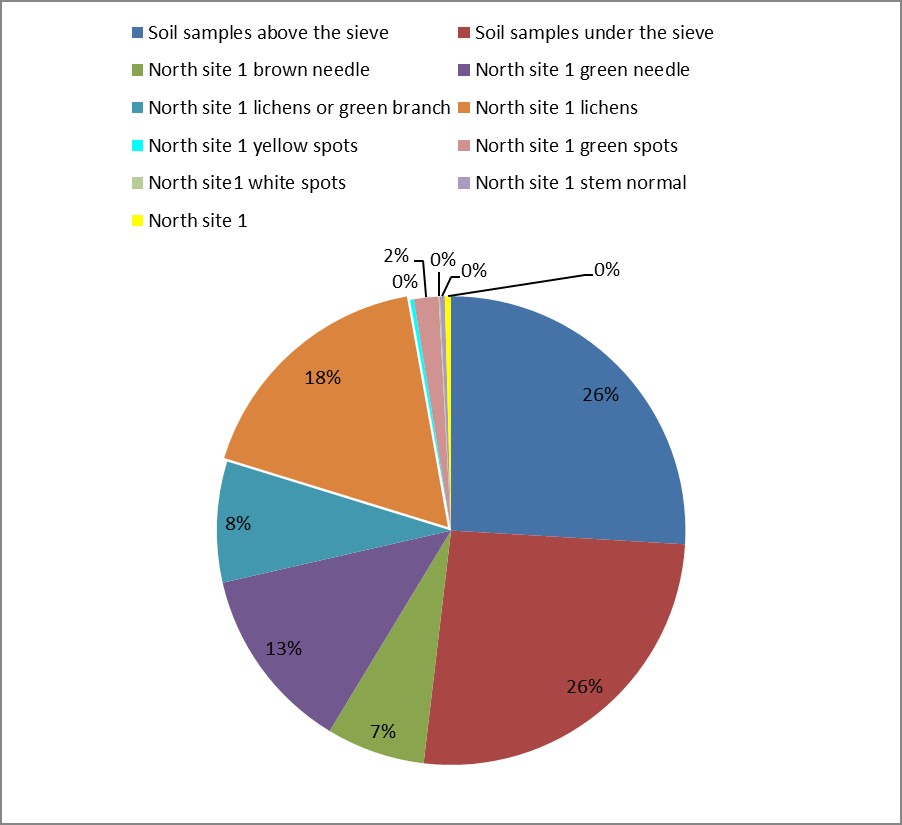
Figure 19: The number of bacteria and total Actinomycetes mass.
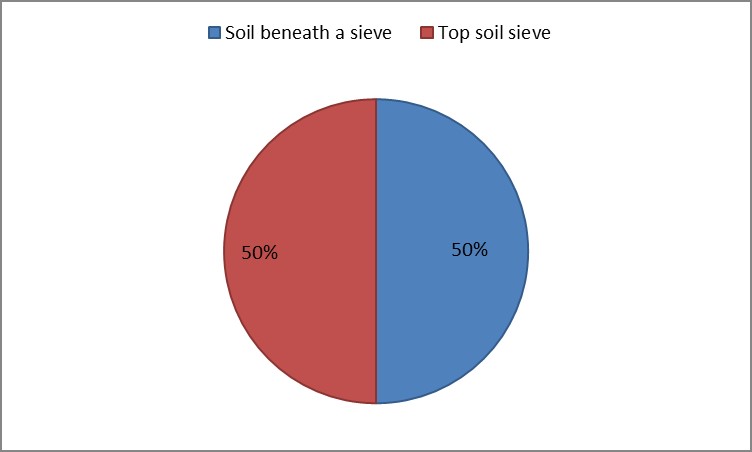
Figure 20: The number of bacterial colonies in soil samples.
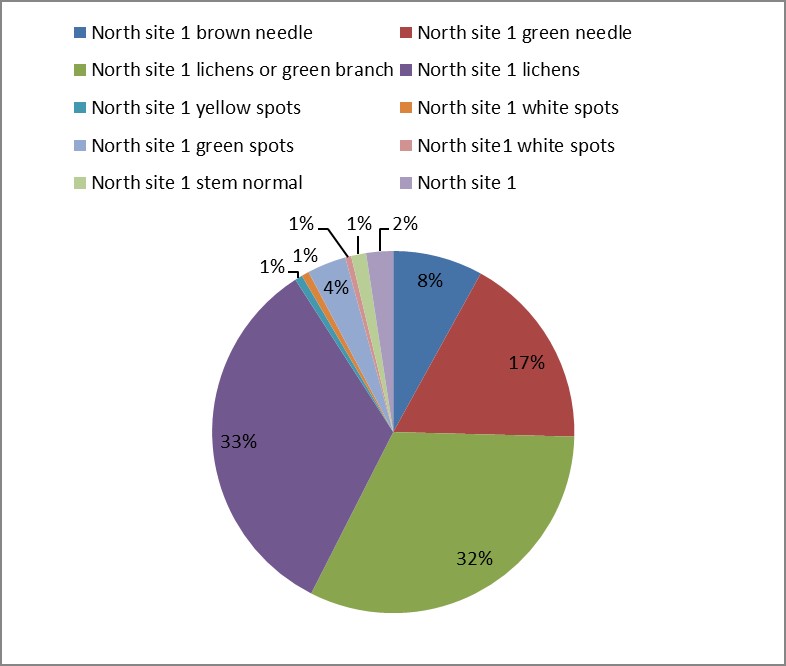
Figure 21: The number of bacteria in the Nutrient Agar media taken by Wipes.
|
Table 11: The Gram stain test, Shape, Endo spores test and Motility test of bacteria on green leaves of Arbutus pavarii plant. |
|||||
|
Sample Name |
Number bacteria |
Gram stain |
Shape |
Endo spores test |
Motility test |
|
Sample healthy |
141 |
gram negative |
Bacillus |
Negative |
positive |
|
Fallen leaves healthy |
246 |
gram negative |
Bacillus |
Negative |
positive |
|
Sample semi healthy |
17 |
gram negative |
Bacillus |
Negative |
positive |
|
Fallen leaves semi healthy |
16 |
gram negative |
Bacillus |
Negative |
positive |
|
Table 12: The Gram stain test, Shape, Endo spores test and Motility test of bacteria on brown leaves of Arbutuspavarii plant. |
|||||
|
Sample Name |
Number bacteria |
Gram stain |
Shape |
Endo spores test |
Motility test |
|
Sample health |
<300 |
gram negative |
Bacillus |
Negative |
Positive |
|
Fallen leaves healthy sample |
261 |
gram negative |
Bacillus |
Negative |
Positive |
|
Semi healthy sample |
<300 |
gram negative |
Bacillus |
Negative |
Positive |
|
Fallen leaves semi healthy |
<300 |
gram negative |
Bacillus |
Negative |
Positive |
|
Sample sick |
|
gram negative |
Bacillus |
Negative |
Positive |
|
Table 13: The Gram stain test, Shape, Endo spores test and Motility test of bacteria on lichens of Arbutus pavarii plant. |
|||||
|
Sample Name |
Number bacteria |
Gram stain |
Shape |
Endo spores test |
Motility test |
|
Sample health |
<300 |
gram negative |
Bacillus |
Negative |
Positive |
|
Sample semi healthy |
<300 |
gram negative |
Bacillus |
Negative |
Positive |
|
Sample sick |
<300 |
gram negative |
Bacillus |
Negative |
Positive |
|
Table 14: The Gram stain test Shape, Endo spores test and Motility test of bacteria on the sub- branches of Arbutus pavarii. |
|||||
|
Sample Name |
Number of bacterial colonies |
Gram stain |
Shape |
Endo spores test |
Motility test |
|
Healthy sample of the highest subsection |
26 |
gram negative |
Bacillus |
Negative |
Positive |
|
Healthy sample from the bottom of the sub- branch |
66 |
gram negative |
Bacillus |
Negative |
Positive |
|
Semi- healthy sample of the highest subsection |
16 |
gram negative |
Bacillus |
Negative |
Positive |
|
Semi- healthy sample from the bottom of the sub- branch |
125 |
gram negative |
Bacillus |
Negative |
Positive |
|
Sample sick of subsection |
<300 |
gram negative |
Bacillus |
Negative |
Positive |
|
Table 15: The Gram stain test, Shape, Endo spores test and Motility test of bacteria on the main branch of Arbutus pavarii. |
|||||
|
Sample Name |
Number of bacterial colonies |
Gram stain |
Shape |
Endo spores test |
Motility test |
|
Healthy sample from the top of the main branch |
36 |
gram negative |
Bacillus |
Negative |
Positive |
|
Healthy sample from the bottom of the main branch |
<300 |
gram negative |
Bacillus |
Negative |
Positive |
|
Semi- healthy sample from the top of the main branch |
160 |
gram negative |
Bacillus |
Negative |
Positive |
|
Semi- healthy sample from the bottom of the main branch |
12 |
gram negative |
Bacillus |
Negative |
Positive |
|
Semi- healthy sample of the main branch |
<300 |
gram negative |
Bacillus |
Negative |
Positive |
|
Sample sick of the main branch |
<300 |
gram negative |
Bacillus |
Negative |
Positive |
|
Table 16: The Gram stain test, Shape, Endo spores test and Motility test of bacteria in the environment Actinomycetes |
|||||
|
Sample Name |
Number of bacterial colonies |
Gram stain |
Shape |
Endo spores test |
Motility test |
|
North site 1 |
5 |
gram negative |
Bacillus |
Negative |
Positive |
|
North site 1 normal stem |
4 |
gram negative |
Bacillus |
Negative |
Positive |
|
North site1 white spots |
1 |
gram negative |
Bacillus |
Negative |
Positive |
|
North site 1 green spots |
20 |
gram negative |
Bacillus |
Negative |
Positive |
|
North site 1 yellow spots |
3 |
gram negative |
Bacillus |
Negative |
Positive |
|
North site 1 lichens |
<200 |
gram negative |
Bacillus |
Negative |
Positive |
|
North site 1 lichens or green branch |
98 |
gram negative |
Bacillus |
Negative |
Positive |
|
North site 1 green needle |
<200 |
gram negative |
Bacillus |
Negative |
Positive |
|
North site 1 brown needle |
80 |
gram negative |
Bacillus |
Negative |
Positive |
|
Soil samples under the sieve |
<300 |
gram negative |
Bacillus |
Negative |
Positive |
|
Soil samples above the sieve |
<300 |
gram negative |
Bacillus |
Negative |
Positive |
Discussion
Antioxidant evaluation of essential oils extracted from Arbutus pavarii Pump. (Ericaceae): The antioxidant activities of essential oils extracted from leaves of Juniperus were evaluated by:
Total phenolic content (TPC) and total flavonoids content (TFC): Data in figure (9) showed that total phenolic content found in essential oils, were the essential oil of sample number 1(plant intact naturally grow) contain high total phenolic content, the results expressed according to pyrogallol as phenolic compound in figure (6). The total flavonoid obtained in this study as shown in figure (10) indicate that the essential oil of sample number 1contain high number of flavonoids compounds as compared with the quercetin in figure (7) which was used as standard. The results of the current study using the Arbutus pavariicorrelated with the findings of other investigators [6] (Mansouri et al., 2011, Nakanishi et al., 2005). Phenols and polyphenolic compounds such as flavonoids are widely found in food products derived from plant sources and they have been shown to poses significant antioxidant activities (Van Ackeret al., 1996).
Reducing power assay (RPA) and the DPPH? radical scavenging activity: Fe (II) reduction is often used as an indicator of electron- donating activity, which is an important mechanism in phenolic antioxidant action (Nabavi et al., 2009). In this assay, the presence of reductants (antioxidants) in the samples would result in the reduction of Fe+3 to Fe+2 by donating an electron. The amount of Fe+2 complex can be then be monitored by measuring the formation of Perl’s Prussian blue at 700 nm. Increasing absorbance at 700 nm indicates an increase in reductive ability. As shown in figure (11) the reducing power assay of essential oil of sample 1and sample 2 exhibits higher reducing activity than the ascorbic acid.
These results obtained from the in vitro antioxidant screened showed that essential oil of sample number 1 and 2 from leaves Arbutus Pavarii has considerable amounts of polyphenols and flavonoids compounds which are responsible for the antioxidant properties. And also, they gave the reductive potential due to reducing capacity and DPPH free radical scavenging activity which serves as strong indicator of antioxidant activities (Figure 12). [7]Fatma and Violet (2013) found that essential oils of Arbutus Pavarii have the highest radical-scavenging activity followed by all medicinal Plants.
The genus Arbutus Pavarii is an important component of arid and semi-arid ecosystems throughout the northern hemisphere (Farjon, 1992; Adams, 2008). Previously, from the genus Juniperus some terpenoids have been isolated (Barrero et al., 2006; Mansouri et al., 2010), neolignanes (Nakanishi et al., 2004) and flavonoids (Inatomi et al., 2005). The species of Arbutus Pavarii is considered as an important medicinal plant largely used in traditional medicine. The anti-inflammatory activity of some diterpenoids of leaves Arbutus Pavarii (Mansouri et al., 2010) and several studies about the essential oil of leaves Arbutus Pavarii have been published (Adams, 2008). All oils of Arbutus Pavarii of five localities from eastern Algeria have a high content of α- pinene, Δ3-carene, limonene, terpinolene and the α-terpinyl acetate (Messaoud et al., 2013).
The phenolic and the flavonoids compounds are groups of secondary metabolites with broad range of biological properties such as: antioxidant, antibacterial ,anti-atherosclerosis, cardiovascular protection and improvement of the endothelial function, it has been reported that antioxidant activity of the phenolic compounds is mainly due to their redox properties which allow them to act as reducing agents, hydrogen donors play an important role by adsorbing and neutralizing reactive free radicals, and chelating ferric ions which catalyses lipid peroxidation, and regarded as promising therapeutic agent for free radical-linked pathologies (Nyangono et al., 2012).
2. The GC-MS analysis of the essential oils extracted from leaves Arbutus Pavarii:
The retention times of the different compounds in the essential oils of Arbutus Pavarii are presented in Table 8. A total of thirty-four volatile compounds, representing 88.29% of the total oil composition in sample 1, were identified in the leaf’s oils (Table 8). Monoterpene hydrocarbons were found to be the major group of compounds. The most abundant component found in the leaf oil was α pinene (20.85%) followed by Germacrene D (16.49%), while α pinene and Germacrene D in sample 2 and sample 3were (12.45%,3.09%) and (9.19% ,1.054%) respectively. Surprisingly, there was a decrease in these compounds in the diseased sample (Table 8). The results are consistent with those obtained by (Angioni et al., 2013) which identified that α pinene and Germacrene D were among the main components of the essentials oils extracted from Arbutus Pavarii spp. Turbinate. The results were also consistent with those reported on the analysis of other juniper oils (Adams et al., 2015, Adams, 1998) in which α pinene was more common. (Achak et al., 2008). The main chemical components of Arbutus Pavarii oil are a-pinene, camphene, b-pinene, sabinene, myrcene, a-phellandrene, a-terpinene, y-terpinene, 1,4-cineole, b-phellandrene, p-cymene, terpinen-4-ol, bornyl acetate, caryophyllene and trace amounts of limonene, camphor, linalool, linalyl acetate, borneol and nerol (http://www.essentialoils.co.za). Through the results we note that these compounds are very few and may be non-existent in diseased sample. The results confirm that some compounds may play an important role as a signal molecule based on signal transduction pathway and cross-talk phenomenon (P. A. Thomas et al., 2007). The interesting compound we found α –pinene has been found in healthy plant in amount 20.85% where in the others were 12.45 and 3.09- respectively. Thus, from biochemical points of view this compound may be the target and the key factor for the retardation of such endogenous plant’s species. More work is needed to understand the actual mechanisms for that compound and its derivatives produced during the plant life cycle. Terpenes have been particularly well studied. Oil extracted from Arbutus Pavarii is known to be diverse: Butkiene et al. (2006) identified 149 different constituents making up 94.9–99.2% of the oils from Lithuanian material. Monoterpenes and sesquiterpenes make up the bulk of this (92–99%) although the balance between these two groups is very variable (monoterpenes: 55– 90%; sesquiterpenes: 13–42%) (Butkiene et al., 2006; Buhl and Duso, 2006). Sixteen different diterpenes have also been isolated from juniper leaves, including ssp. hemispherical (Pascual Teresa et al., 1980). Through our results we note that the weight of Leaf after drying (mg) of diseased sample is more than in the Healthy sample. The length of the Healthy sample was 222.67 cm while diseased sample was 214.23 cm and We found Stem diameter of 16.42 cm Healthy sample while diseased sample and semi-sample (11.22cm and 9.89 cm) respectively. The results obtained in this study as shown in table (10) indicate that the healthy sample contain high amount of Chlorophyll A, Chlorophyll B and Carotenoids as compared with the Semi healthy sample and Sample disease. This leads us to the link between the chemical content and shape of the outer plant.
Mariam and Salem (2015): showed Arbutus Pavarii plants in EL-Gabal EL-Akhdar area are exposed to huge stress which caused by climatic changes. During obvious years, the rates of precipitation in the study area were clearly decreased, while temperature levels and seasonal drought period were increased. The phenomena of "plant-climate interactions" were clear in our results and it was reflected by increasing damage and death of juniper plants because of shortage of water (rainfalls). The healthy growth, good vegetation cover, and increasing plant frequency in study site number. Not only has the nature played rule in this damage, but anthropogenic factors. Due to over population in the area during few last years, the pressure on vegetation composition was increased rapidly and subsequently, huge number of plant species like juniper were affected. The activities those noticed and recorded in the study area included mining, overgrazing, fire wood collection and fire making, expansion of urbanization, agricultural processes, medicinal plants collection, and effect of weekenders (Mariam and Salem, 2015). The data showed to be the first report gave the scientific communities especially where the plant canopy exists specifically in Mediterranean region and Al-Jabal Al- Akhdar area. Many researchers attempt to find out what is going on. But no clear data can interpret the problems even some plants in the same location with the same environmental and soil conditions but you will see some plant totally destroyed and some fully healthy, this led us to go deeper and to put our hypothesis taken all other studies under consideration. Although chemical characteristics has been conducted on this species, additional research is still required to analyses the essential oils of this species in the studied region
Conclusion
Summary and conclusion: Medicinal plants are of great importance to the health of individuals and communities. The medicinal value of these plants lies in some chemical substances that produce a definite physiological action on the human body. The most important of these bioactive constituents of plants are alkaloids; tannins, flavonoids, and phenolic compounds. Many of these indigenous medicinal plants are used as spices and food plants.
The aim of this study was to investigate and identify some of the physiological characteristics of the Arbutus Pavarii L, determine the chemical composition and antioxidant activity. Antioxidant evaluation of essential oils extracted from Arbutus Pavarii: Total phenolic content that found in essential oils were the essential oil of sample number (1) (intact plant grow naturally) contain high total phenolic content, the results expressed according to pyrogallol as phenolic compound. These results obtained from the in vitro antioxidant screened showed that essential oil of healthy sample and semi healthy sample from leaves Arbutus Paravians considerable amounts of polyphenols and flavonoids compounds which are responsible for the antioxidant properties. In addition, they give the higher reductive potential due to reducing capacity and DPPH free radical scavenging activity, which serves as strong indicator of antioxidant activities (Figure 12). The GC-MS of the essential oils extracted from leaves Arbutus Pavarii: The retention time of the different compounds in the essential oils of J. Phoenicia are presented in Table 8. A total of thirty-four volatile compounds, representing 88.29% of the total oil composition in sample 1, were identified in the leaf’s oils (Table 8). Monoterpene hydrocarbons were found to be the major group of compounds. The most abundant component found in the leaf oil was α pinene (20.85%) followed by Germacrene D (16.49%), while α pinene and Germacrene D in sample 2 and sample 3were (12.45%,3.09%) and (9.19% ,1.054%) respectively. Surprisingly, there were decrease of these compounds in the sample diseased (table 8). The main chemical components of Arbutus Pavarii oil are a-pinene, camphene, b-pinene, sabinene, myrcene, a-phellandrene, a-terpinene, y-terpinene, 1,4-cineole, b-phellandrene, p-cymene, terpinen-4-ol, bornyl acetate, caryophyllene and trace amounts of limonene, camphor, linalool, linalyl acetate, borneol and nerol. (http://www.essentialoils.co.za).
Through the results we note that these compounds are very few and may be non-existent in diseased sample. The interesting compound we found α –pinene has been found in healthy plant in amount 20.85% where in the others were 12.45 and 3.09- respectively. Thus, from biochemical points of view this compound may be the target and the key factor for the retardation of such endogenous plant’s species. Through the results, we note that the weight of Leaf after drying (mg) of diseased sample is more than in the healthy sample. The length of the healthy sample was 222.67 cm while diseased sample was 214.23 cm and We found Stem diameter of 16.42 cm Healthy sample while diseased sample and semi-sample (11.22 cm and 9.89 cm) respectively. The results obtained in this study as shown in table (10) indicate that the healthy sample contained high amount of chlorophyll A, chlorophyll B and carotenoids as compared with the semi healthy sample and disease sample. This leads us to the link between the chemical content and shape of the outer plant.
Conclusion
We conclude from the results that reduction of the chemical compounds of Arbutus Pavarii content plays a role in the extinction of this plant. Although chemical characteristics has been conducted on this species, additional research is still required to analyses the essential oils of this species in the studied region to support this result.
References
1. Andrada A., and T. Mari´A Cristina (2005) Pollen collected by honey bees (Apis mellifera L.) from south of Calde´n district (Argentina): botanical origin and protein content, Grana, 44: 115–122.
2. Bertoncelj J., Doberšek U., Jamnik M., and T. Golob (2007) Evaluation of the phenolic content, antioxidant activity and color of Slovenian honey. Food Chemistry, 105, 822-828.
3. Bilisik A., Cakmak I., Bicakci A., and M. Hulusi, (2008) Seasonal variation of collected pollen loads of honeybees,(Apis melliferaL. anatoliaca), Grana, 47: 70–77.
4. Bogdanov, S., Ruoff, K. and2 L. P. Oddo (2004), European unifloral honeys. Apidologie, 35: (1), 4 - 17.
5. Bouls, L. (1975) “The Mediterranean element in the flora of Libya”, in La flora De Bassin Mediterranean, Paris.
6. El abidi, N., and S., Elshatshat (2016), the effect of microhabitat on qualitative characteristics of the wild jujube Ziziphus lotus (L.) Desf.Libyan honey type, Journal of Chemical and Pharmaceutical Research.
7. El shatshat, S., (1997) Physiological Ecology of Arbutus pavarii Pamp. M.Sc. Thesis, Garyounis University, Benghazi, Libya.
8. El shatshat, S., (2009), Biological conservation of the endemic Arbutus pavarii Pamp.: Seed germination as attempt, International Journal Of Human Geography And Environmental Studies.
9. El shatshat, S., ( 2015), Increasing anthropogenic impacts on restricted-range taxa of Libya from 2011 to 2015, Archives of Applied Science Research, 7 (5):91-96.
10. El shatshat S., Thabt G. and N. Elhashani (2009). Critical situation of the vegetation of EL- Gabal EL- Akhdar area: Physical and anthropogenic factors and their effects on wild utilized and endemic taxa, International Journal of Sustainability Science and Studies, 1: 61-63.
11. Ferreira I. C., Aires F. R., Barreira J. C. M., and L. M. Estevinho (2009) Antioxidant activity of Portuguese honey samples: Different contributions of the entire honey and phenolic extract. Food Chemistry, 114, 1438-1443.
12. Gimingham, C. H. & K. Walton (1954) Environment and the scrub communities on the limestone plateau of northern Cyrenaica”, Journal of Ecology 42, 505-520.
13. Keith, H. G. (1965) Preliminary check list of flora of Libya”, Ministry of agriculture, Tripoli, Libya.
14. Louveaux J., Maurizio M. and G. Vorwohl (1970) Methods of melissopalynology, International Commission for Bee, Botany of IUBS, 51(3): 125-138.
15. Qaisor, M. and A. Elgadi (1986) Critical analysis of the flora of Libya, Libyan journal of science 13, 32- 40.
16. Ponits J. A., Mendonça, L. A., Costa A., Silva J. R. and A. Flach (2013) Color, phenolic and flavonoid content, and antioxidant activity of honey from Roraima, Food Sci. Technol, Campinas, 34(1): 69-73.
17. Siddqi, M., A. (1977) Flora of Libya, Elfateh Uni., Tripoli, Libya.
18. Research, 8(8):1199-1202.
19. Terrab A., Pontis A., Heredia F. and M. Di'ez (2004). A preliminary palynological characterization of Spanish thyme honeys, Botanical Journal of the Linnean Society, 146, 323–330.
20. Walter K. S. & H. J. Gellitt, “IUCN red list of threatened plants”, The world conservation monitoring center, 1997.
21. Al-Rehaily, A. J., S. I. Alqasoumi, H. S. Yusufoglu, M. A. Al-Yahya, B. Demirci, N. Tabanca, D. E. Wedge, F. Demirci, U. R. Bernier, J. Becnel, H. E. Temel, and K. H. Baser. 2014. Chemical composition and biological activity of Haplophyllum tuberculatum Juss. essential oil. Journal of Essential Oil Bearing Plants 17 (3): 452-459.
22. Bertsouklis, K. F., and M. Papafotiou. 2009. In vitro propagation of Arbutus andrachne L. Acta Hort. 813: 477-479.
23. El-Darier, S. M., and F. M. El-Mogaspi. 2009. Ethnobotany and relative importance of some endemic plant species at El-Jabal El-Akhdar Region (Libya). World Journal of Agricultural Sciences 5 (3): 353-360.
24. Elmaghrabi, A. M., and S. J. Ochatt. 2006. Isoenzymes and flow cytometry for the assessment of true-to-typeness of calluses and cell suspension of barrel medic prior to regeneration. Plant Cell Tissue Org. Cult. 85: 31-43.
25. Elmaghrabi, A. M., E. Abughnia, and S. Hamoud. 2017. In vitro propagation of the wild medicinal plant, caper (Capparis spinosa L.). African Journal of Biotechnology. ISSN: 1684-5315. http://www. academicjournals.org/AJB. (under press).
26. El-Naggar, E. B., S. M. El-Darier, A. A. El-Mekanen, E. Švajdlenka, and M. Zemlièka,. 2014. Chemical Composition of Essential Oil of Haplophyllum tuberculatum (Rutaceae) Grow Wild in Different Habitats of Egypt. Global Journal of Pharmacology 8 (3): 385-393.


