
-
Mail us:
editor@raftpubs.org
- ISSN : xxxx-xxxx
Indexing & Abstracting
Full Text
Research ArticleDOI Number : 10.36811/ijpsh.2020.110019Article Views : 12Article Downloads : 29
Comparative Studies of Intra and Inter Specific Hybrid of F2 Generations in Mungbean
Pandiyan M*, Krishnaveni A, Sivakumar P, Vaithiyalingan M, Jamuna E, Radhakrishnan and Sivakumar C#
Agricultural College and Research Institute,Tamil Nadu Agricultural University, Vazhavachanur, Thiruvannamalai, Tamil Nadu, India
*Corresponding Author: Pandiyan M, Agricultural College Research Institute, Tamil Nadu Agricultural University, Vazhavachanur - 606 753 Tiruvannamalai District, Tamil Nadu, India, Email: mpandiyan8@yahoo.co.in
#Co-Corresponding author: Sivakumar C, Email: siva15@yahoo.co.in
Article Information
Aritcle Type: Research Article
Citation: Pandiyan M, Krishnaveni A, Sivakumar P, et al. 2020. Comparative Studies of Intra and Inter Specific Hybrid of F2 Generations in Mungbean. Int J Plant Sci Hor. 2: 01-11.
Copyright: This is an open-access article distributed under the terms of the Creative Commons Attribution License, which permits unrestricted use, distribution, and reproduction in any medium, provided the original author and source are credited. Copyright © 2020; Pandiyan M
Publication history:
Received date: 18 December, 2019Accepted date: 06 January, 2020
Published date: 09 January, 2020
Abstract
Intra and interspecific hybridization was done for developing donor with respect to MYMV and Bruchids resistance. Several differences in many characters were observed in intra and interspecific hybrids crosses for certain characters. Among all the combination of both intra and interspecific crosses studied, single plant yield increased through only intra specific crosses attempted while resistance to biotic stresses like MYMV and bruchids were improved by interspecific crosses. Hence the utilization of wild species in crop improvement is very effective for donor development compared to intra specific crosses.
Keywords: Vigna radiata; Wild Vigna species Intra and Interspecific; Hybridization; Comparative Traits
Introduction
Vigna radiata (L.) wilczek, commonly known as greengram (mungbean) is the most widely distributed one among cultivated Vigna species. Mungbean gives predominant sources of protein and essential amino acids like lysine and tryptophan in vegetarian diets. It is highly drought tolerant and well suited to wide range of soil conditions including light soils and can thrive even under limited irrigation; moreover, it is suited for crop rotation and crop mixtures [1,2]. However, this crop is suffering from the yield advantage as realized in case of C4 cereals. India is the highest producer, consumer and importer in pulses, to get higher yield to create variation through wild hybridization. At present the yield level of greengram as like other pulses is well below the optimum level. The average yield of mungbean is very low not only in India (425 kg/ha) but in entire tropical and subtropical Asia. In Tamil Nadu it is cultivated in an area of 1.63 lakhs hectare with a production of 0.78 lakhs tonnes. Even good quality seeds distributed to the farmers or growers by the departments and university besides management factors the prime cause for the low productivity leads to the inherently low yielding potential of the cultivars coupled with susceptibility to diseases. In the crop improvement programme of mungbean crop we facilitated several ways to do research even then could not achieved the goal due to low variability among the accessions. We need to go to make cross in wild species of Vigna Hopeful to the breeders that utilization of primary, secondary and tertiary gene pools of this crop can result in tremendous improvement in yield. There may be lot chance to when we utilize the variability available in the primary gene pool, it is imperative to critically characterize and evaluate the available germplasm collections in different species , establishing core collections is a good way to identify the diversified materials in the germplasm to eliminate redundancy and employing divergent parents to obtain useful segregants by crossing programme. The core collection concept was suggested by [3], who defined it as a representative sample of a collection where as much as possible of the diversity of the collection, is retained with minimum redundancy.To compare the variability created for yield and yield components among segregants generated through intra and interspecific hybridization.
Materials and Methods
Study of selected crosses of F2 plants from intra and interspecific segregants. The F2 crosses of selected cross combinations from intra and interspecific crosses along with male and female parents with a spacing of 45 x 30 cm during summer 2015 at Agricultural Research Station, Tamil Nadu Agricultural University, Virinjipuram, Vellore. The following crosses in intra specific namely VRM(Gg)1 x Vellore Local, K1 x Pusa bold, VBN1 x Vellore local and VRM(Gg)1 x ML 682 and interspecific crosses viz., V. radiata x V. radiata Var Sublobata, Vigna radiata x V.radiata . mungo var silvestris, Vigna. radiata x Vigna umbellata, Vigna radiata x Vigna. haineana and Vigna radiata x Vigna. trilobata were forwarded to F2 generation to study the frequency of traits and also performance at comparative ways between intra and interspecific crosses The F2s along with their parents of four selected crosses in intraspecfic crosses were sown with a spacing of 30 x 10 cm. All 13 quantitative traits observed in F1 generation was recorded for all the individual plants in the selected F2 generation for both intra and interspecific crosses. Descriptive statistical parameters such as mean, minimum, maximum, variance, SE, SD, skewness and kurtosis were computed. The frequency distribution of F2 segregants of all four crosses for the following traits viz., number of branches per plant, length of branch, number of clusters per branch, number of clusters per plant, number of pods per plant and hundred seed weight which exhibited significant correlation with seed yield were computed and represented as frequency graphs.
Quantitative characters
Thirteen quantitative characters are 1. Plant height (cm), 2. Number of branches per plant 3. Length of branches (cm)4. Days to 50 per cent flowering 5. Number of clusters per branch 6. Number of clusters per plant 7. Number of pods per plant 8. Pod length (cm) 9. Number of seeds per pod 10. Hundred seed weight (g) 11. Grain yield per plant (g) 12. Dry matter production 13. Days to maturity were recorded.
Qualitative characters
To analyse the segregation pattern for morphological traits and to evaluate the level of chromosomal elimination in F2 generation of interspecific crosses, a morphological scoring method was followed in the F2 population , The Qualitative characters were recorded in F1 hybrids and their respective parents such as Stem colour, Stem hairiness, Leaf colour, Leaf shape, flower colour, Mature pods colour, Pods hairiness, Arrangement of the pods, Standard petals colour, Seed colour, Cotyledon colour, Tendril, Seed shape and branching pattern were scored in F2 population.
Result
For comparison of variation generated in the F2 segregants, the frequency distribution graphs were plotted by combining the values of all the F2 progenies irrespective of the crosses. Data on six traits revealed positive correlation with seed yield were plotted. The comparison of skewness kurtosis for intra and interspecific crosses are presented in table 1.
|
Table 1: The comparison of skewness and kurtosis for intraspecific and interspecific direct and reciprocal crosses. |
||||||
|
Characters |
Skewness |
Kurtosis |
||||
|
|
Intraspecific |
Interspecific direct crosses |
Interspecific reciprocal |
Intraspecific |
Interspecific direct crosses |
Interspecific reciprocal |
|
Number of branches per plant |
1.78 |
0.89 |
0.62 |
12.82 |
0.64 |
-0.22 |
|
Length of branch (cm) |
0.51 |
0.00 |
0.42 |
-0.48 |
0.15 |
0.16 |
|
Number of clusters per Branch |
1.06 |
1.20 |
0.89 |
0.41 |
1.53 |
-0.17 |
|
Number of clusters per plant |
0.89 |
5.10 |
1.54 |
0.28 |
34.02 |
2.93 |
|
Number of pods per plant |
1.00 |
-0.43 |
0.89 |
1.24 |
0.95 |
0.39 |
|
Hundred seed weight (g) |
-0.30 |
0.70 |
0.69 |
1.30 |
0.60 |
-0.44 |
|
Single plant yield (g) |
1.11 |
1.18 |
0.44 |
1.66 |
1.57 |
0.04 |
1. The frequency distribution graphs are presented as Figure 1A-1C to Figure 7A-7C.
Based on the skewness of frequency distribution the gene action for the seven traits were interpreted and the results for Number of branches per plant for this trait, in the case of intra specific F2 generation the mean value is 1.52 with maximum of 12.00 (Table 2.). The values for skewness high and positive indicating that most of the population distribution is in the negative side as compared to the population mean it is also indicate dominant nature of the alleles. (Figure 1A).
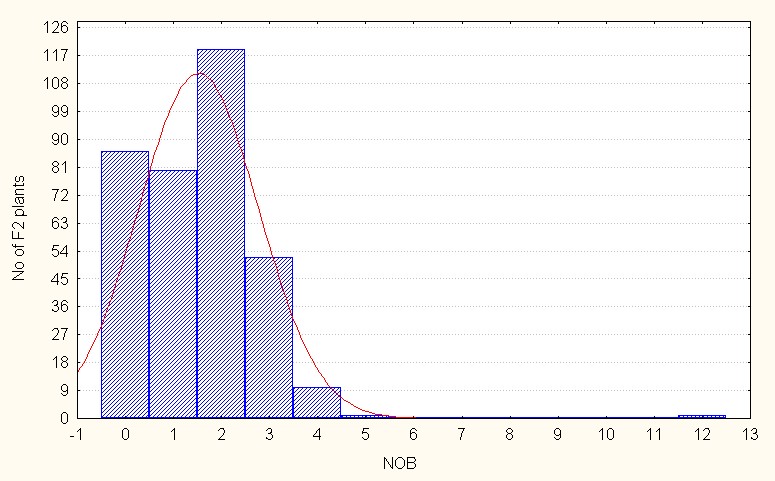
Figure 1A: Intraspecific crosses.
|
Table 2: Descriptive statistics for yield contributing characters among over all F2 families of intraspecific crosses. |
|||||||||||||||||
|
Crosses |
Mean |
Min |
Max |
Variance |
SD |
SE |
Skewness |
Kurtosis |
|
||||||||
|
NOB |
1.52 |
0.00 |
12.00 |
1.56 |
1.25 |
0.06 |
1.78 |
12.82 |
|
||||||||
|
BRL |
26.79 |
0.00 |
90.00 |
502.14 |
22.40 |
1.19 |
0.51 |
--.048 |
|
||||||||
|
NCB |
2.94 |
0.00 |
14.00 |
9.90 |
3.14 |
0.16 |
1.06 |
0.41 |
|
||||||||
|
NOC |
9.06 |
2.00 |
22.00 |
13.92 |
3.73 |
0.19 |
0.89 |
0.28 |
|
||||||||
|
NPP |
29.98 |
8.00 |
87.00 |
166.15 |
12.89 |
0.68 |
1.00 |
1.24 |
|
||||||||
|
HSW |
3.48 |
1.16 |
4.90 |
0.23 |
0.48 |
0.02 |
--0.28 |
1.27 |
|
||||||||
|
SPY |
7.91 |
1.89 |
22.79 |
12.95 |
3.59 |
0.19 |
1.12 |
1.67 |
|
||||||||
In the interspecific direct crosses, F2 population recorded an overall mean of 1.52 to 4.00 branches per plant (Table 3.). The skewness is positive but less than 1 indicating presence of dominant alleles to a lesser extent. (Figure 1B).
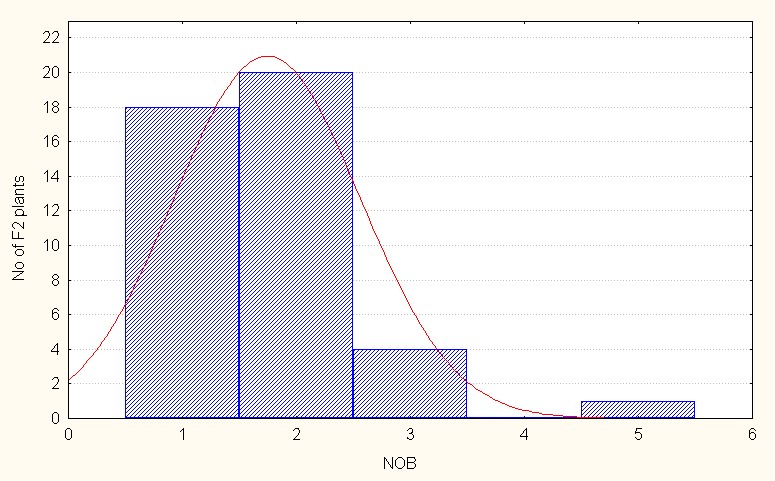
Figure 1B: Interspecific direct crosses.
|
Table 3: Descriptive statistics for yield contributing characters among over all F2 families of interspecific direct crosses. |
||||||||
|
Crosses |
Mean |
Min |
Max |
Variance |
SD |
SE |
Skewness |
Kurtosis |
|
NOB |
1.52 |
0.00 |
4.00 |
0.90 |
0.94 |
0.11 |
0.89 |
0.94 |
|
BRL |
16.18 |
0.00 |
42.00 |
73.46 |
8.57 |
1.03 |
--0.00 |
0.14 |
|
NCB |
2.44 |
0.00 |
8.00 |
3.30 |
1.81 |
0.21 |
1.20 |
1.53 |
|
NOC |
6.01 |
2.00 |
45.00 |
31.74 |
5.63 |
0.67 |
5.10 |
34.02 |
|
NPP |
6.89 |
4.30 |
9.00 |
0.69 |
0.83 |
0.10 |
-0.43 |
0.94 |
|
HSW |
2.31 |
1.17 |
4.32 |
0.39 |
0.62 |
0.07 |
0.70 |
0.59 |
|
SPY |
2.86 |
0.98 |
8.52 |
2.34 |
1.52 |
0.18 |
1.18 |
1.56 |
In the case of interspecific reciprocal crosses of the F2 population mean value was 1.90 with a maximum of 4.00 branches (Table 4.). The skewness was again positive but less than 1 (0.62) indicating presence of lesser extent of dominance. (Figure 1C).
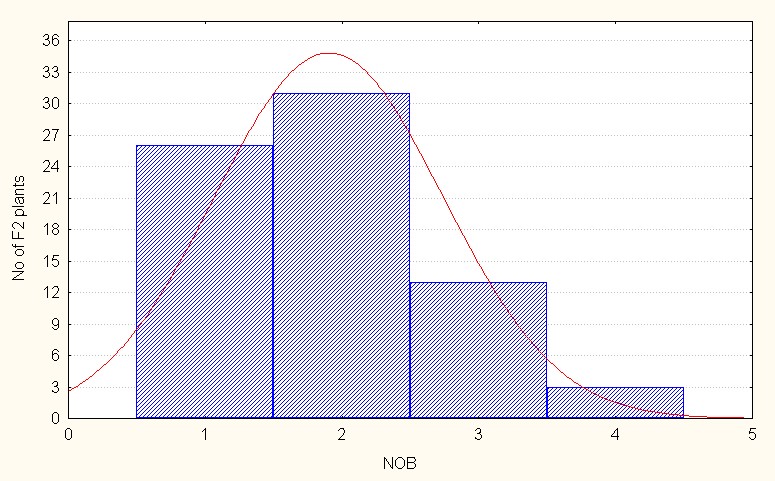
Figure 1C: Interspecific reciprocal crosses.
Figure 1: A-C. Frequency distribution for number of branches per plant among F2 segregants
|
Table 4: Descriptive statistics for yield contributing characters among over all F2 families of interspecific reciprocal crosses. |
||||||||
|
Crosses |
Mean |
Min |
Max |
Variance |
SD |
SE |
Skewness |
Kurtosis |
|
NOB |
1.90 |
1.00 |
4.00 |
0.69 |
0.83 |
0.09 |
0.62 |
-0.22 |
|
BRL |
23.45 |
3.00 |
48.00 |
93.94 |
9.69 |
1.13 |
0.42 |
0.16 |
|
NCB |
2.31 |
1.00 |
6.00 |
1.85 |
1.36 |
0.15 |
0.89 |
-0.16 |
|
NOC |
4.64 |
2.00 |
15.00 |
7.12 |
2.66 |
0.31 |
1.54 |
2.93 |
|
NPP |
15.22 |
1.50 |
49.00 |
126.43 |
11.24 |
1.31 |
0.91 |
0.39 |
|
HSW |
2.81 |
1.16 |
5.30 |
1.26 |
1.12 |
0.13 |
0.69 |
-0.43 |
|
SPY |
3.19 |
0.48 |
6.90 |
2.42 |
1.55 |
0.18 |
0.44 |
0.04 |
Length of branch (cm) In the intraspecific crosses, the F2 population recorded a mean value of 26.79 with the maximum value of 90.00 (Table 2). The value of skewness is positive and low in magnitude (0.52) indicating that presence of dominant gene action to lesser extent. (Figure 2A).
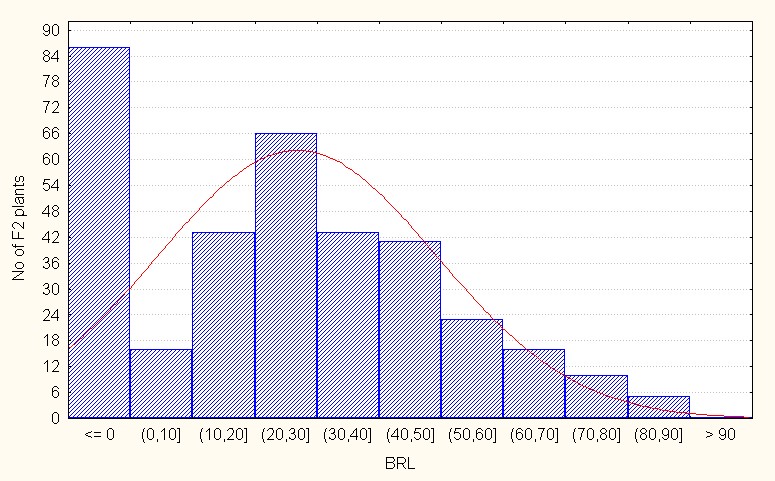
Figure 2A: Intraspecific crosses.
For interspecific direct crosses the population mean was 16.18 with maximum value of 42.00 (Table 3). The skewness is negative and low in magnitude (0.01) indicating less extent of additive gene action in the population. (Figure 2B).
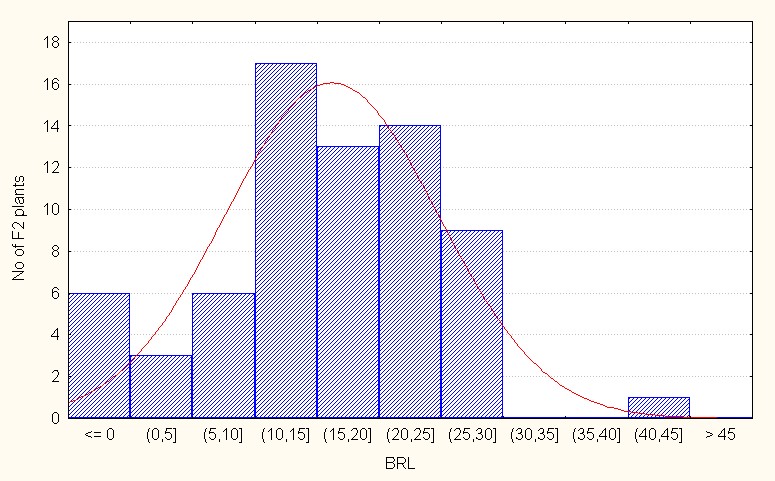
Figure 2B: Interspecific direct crosses.
Regarding interspecific reciprocal crosses, the population mean was 23.45 with a maximum of 48.00 (Table 4). The skewness value was positive and low (0.42) reflecting presence a few dominant alleles. (Figure 2C).
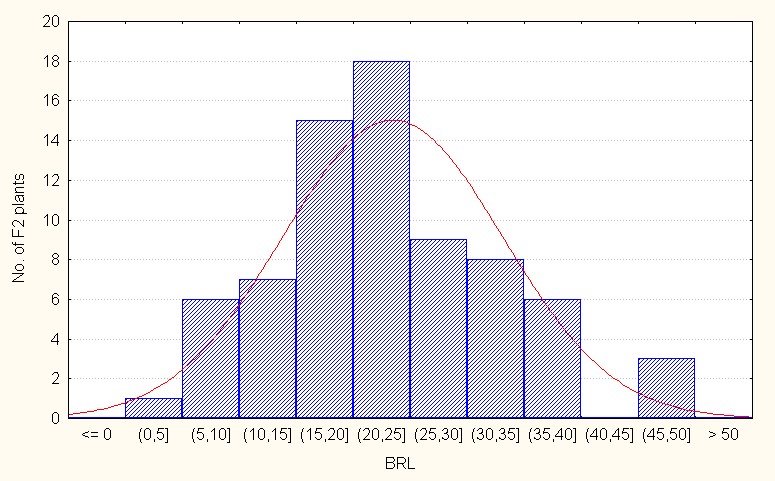
Figure 2C: Interspecific reciprocal crosses.
Figure 2: A-C. Frequency distribution for length of branches among F2 segregants
Number of clusters per branch, for number of clusters per plant in the intra specific crosses F2 generation mean value is 2.94 with the maximum of 14.00 (Table.2). The skewness value is low and positive (1.06) indicating that the population distribution is in the negative side at compared to the population mean. It also indicative dominant nature of the most of alleles. (Figure 3A).
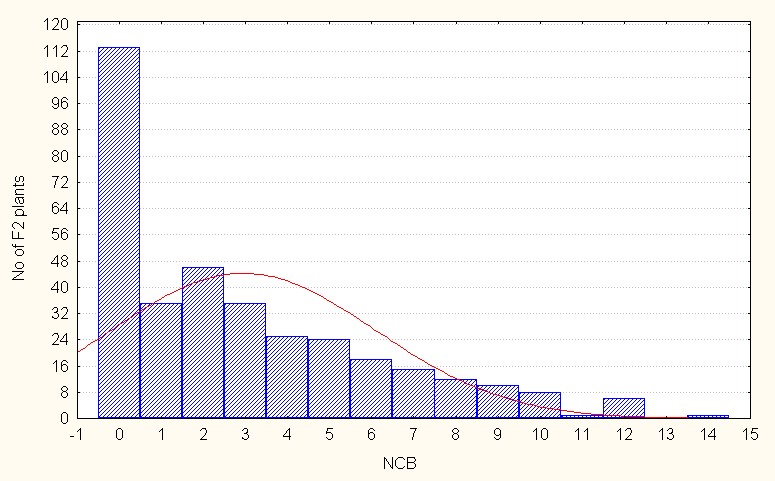
Figure 3A: Intraspecific crosses.
In the interspecific direct crosses, the F2 population recorded an overall mean of 2.44 with 8.00 (Table.3). The skewness is positive indicating that presence of dominant alleles to a lesser extent. (Figure 3B).
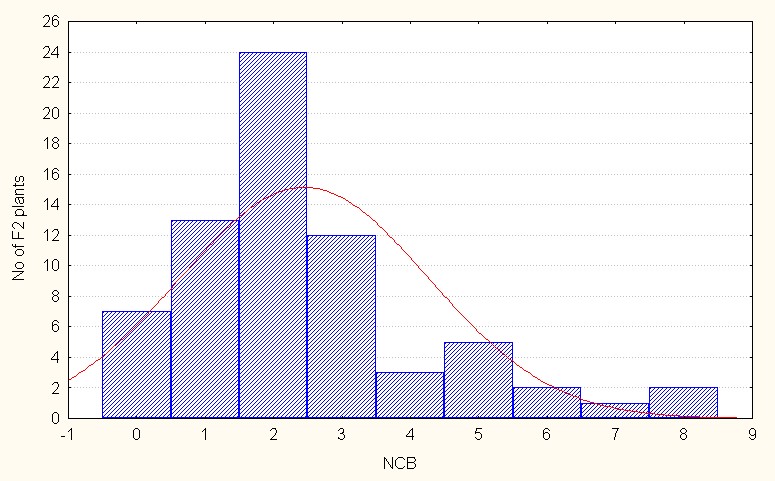
Figure 3B: Interspecific direct crosses.
In the case of interspecific reciprocal crosses the F2 population mean value was 2.31 with 6.00 (Table 4). The skewness value is positive but less than 1 (0.89) indicating that the population distribution is in the negative side as compared to the population mean. It is indicative dominant nature of the most of the alleles. (Figure 3C).
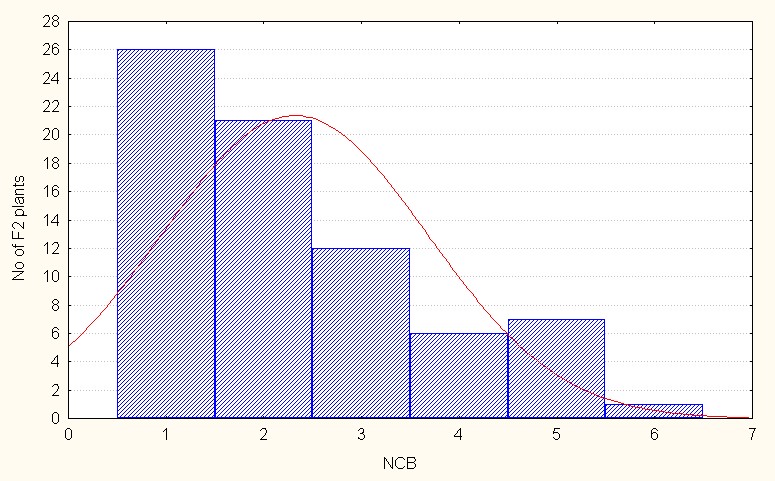
Figure 3C: Interspecific reciprocal crosses.
Figure 3: A-C. Frequency distribution for number of cluster per branch among sergeants.
Number clusters per plant
For this trait, in the case of intra specific F2 generation, the mean value is 9.06 with maximum of 22.00 (Table 2.). The values for skewness low and positive indicating that most of the population distribution is in the negative side as compared to the population mean it is also indicate dominant nature of most of the alleles. (Figure 4A).
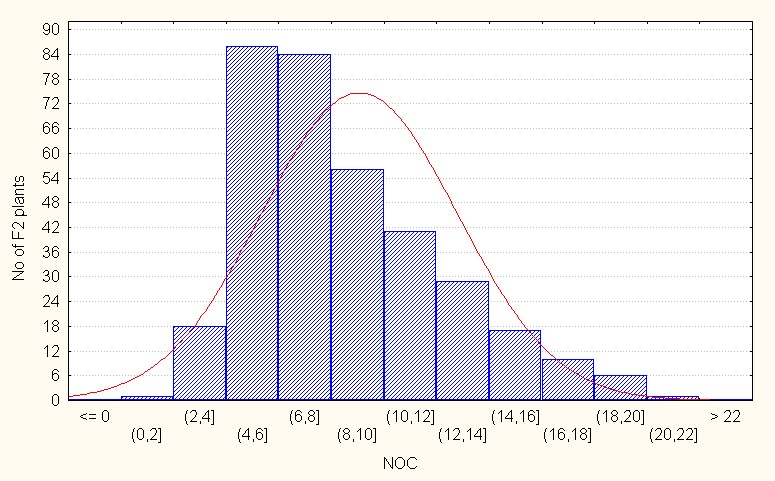
Figure 4A: Intraspecific crosses.
In the interspecific direct crosses, F2 population recorded an overall mean of 6.01 with maximum of 45.00 clusters (Table 3). The skewness is high (5.10) positive indicating presence of dominant alleles. (Figure 4B).
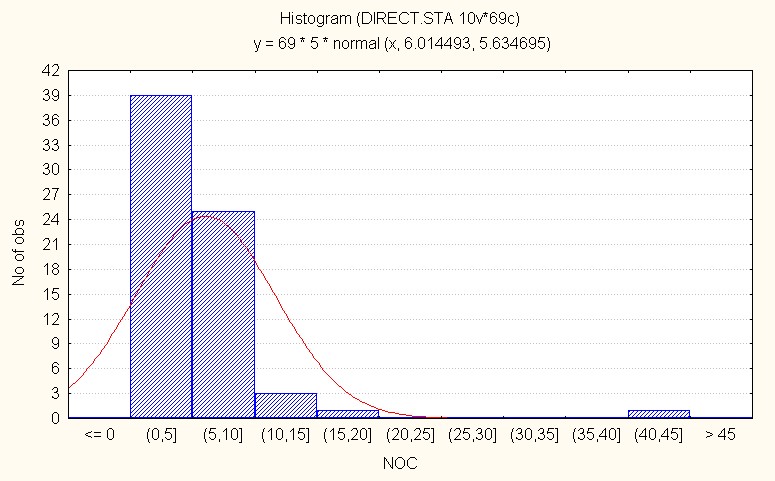
Figure 4B: Interspecific crosses.
In the case of interspecific reciprocal crosses of the F2 population mean values were 4.64 with a maximum of 15.00 clusters (Table 4). The skewness was again positive indicating presence of dominance alleles. (Figure 4C).
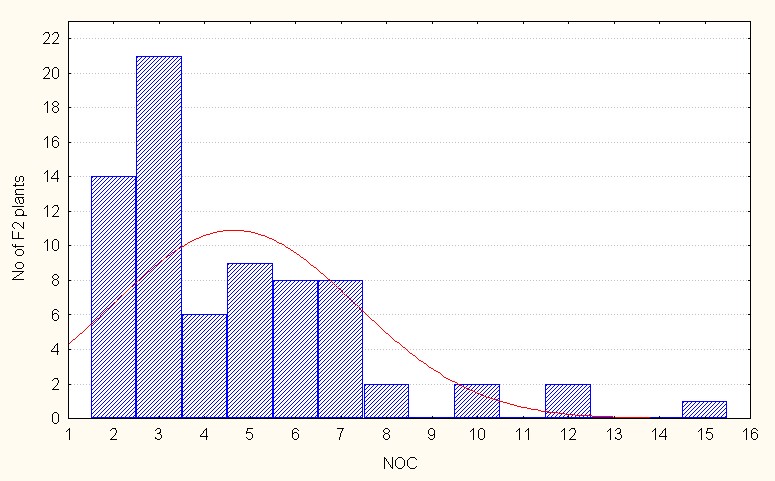
Figure 4C: Interspecific reciprocal crosses.
Figure 4: A-C. Frequency distribution for number of cluster per plant among F2 segregants
Number of pods per plant, In the intraspecific crosses, the F2 population recorded a mean value of 29.98 with the maximum value of 87.00 (Table 2). The value of skewness is positive (1.00) indicating that presence of dominant gene action to lesser extent. (Figure 5A).
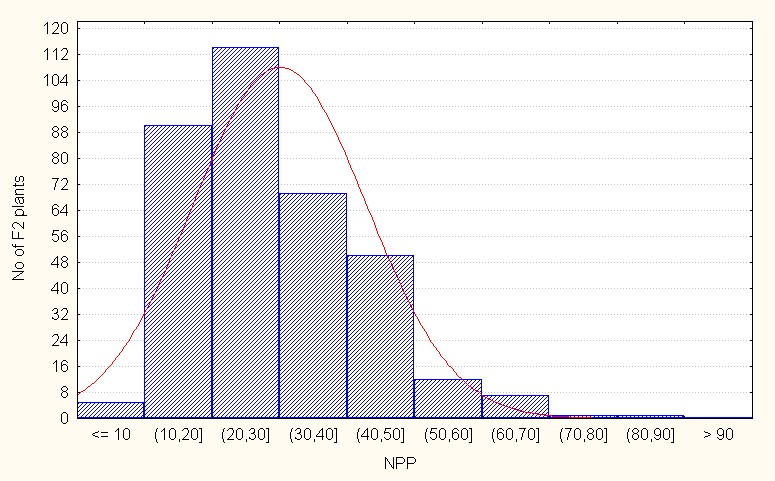
Figure 5A: Intraspecific crosses.
For interspecific direct crosses the population mean was 6.89 with maximum value of 9.00 (Table 3). The skewness is negative and low in magnitude (-0.43) indicating less extent of additive gene action in the population. (Figure 5B).
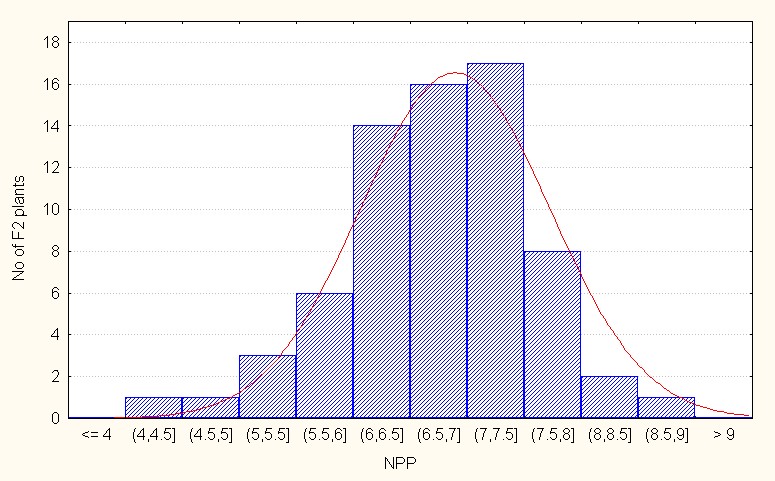
Figure 5B: Interspecifc direct crosses.
Regarding interspecific reciprocal crosses, the population mean was 15.22 with a maximum of 49.00 (Table 4). The skewness value was positive and low (0.89) reflecting presence a few dominant alleles (Figure 5C).
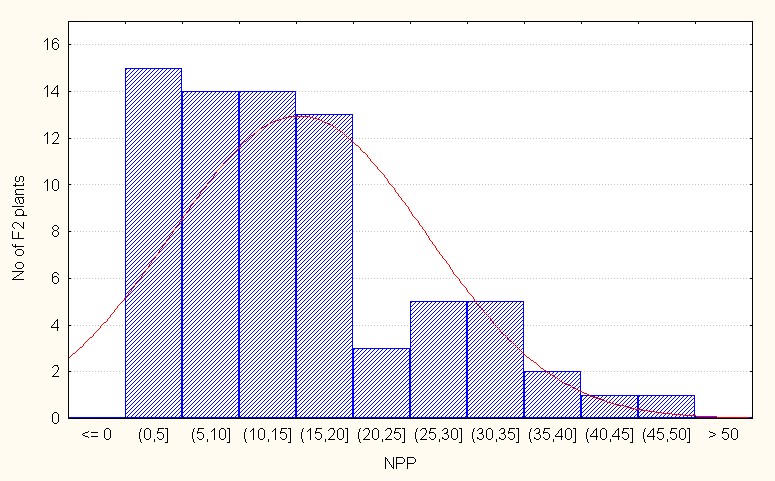
Figure 5C: Interspecifc reciprocal crosses.
Figure 5: A-C. Frequency distribution for number of pods per plant among F2 segregants
Hundred seed weight for hundred seed weight, in the intra specific crosses F2 generation mean value is 3.48 with the maximum of 4.90 (Table 2). The skewness value is low and negative (-0.30) indicating that the population distribution is in the negative side at compared to the population mean. It also indicative additive nature of the most of alleles. (Figure 6A).
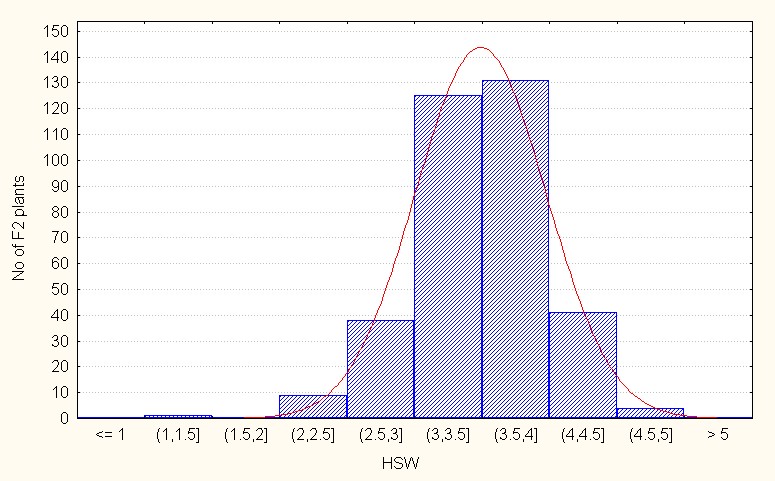
Figure 6A: Intraspecific crosses.
In the interspecific direct crosses, the F2 population recorded an overall mean of 2.31 with 4.32 (Table 3). The skewness value (0.70) is positive indicating that presence of dominant alleles to a lesser extent (Figure 6B).
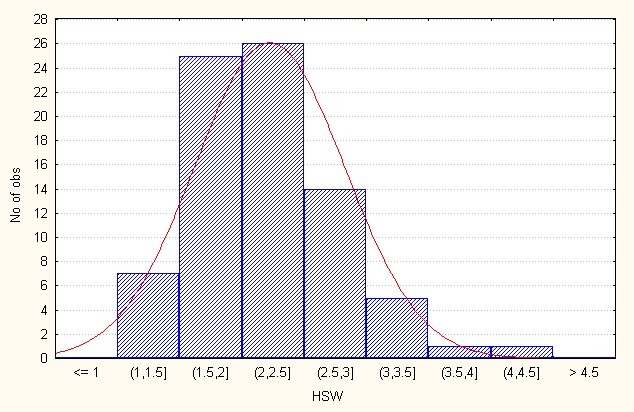
Figure 6B: Interspecific direct crosses.
In the case of interspecific reciprocal crosses the F2 populations mean value was 2.81 with 5.00 (Table 4). The skewness value is positive but less than 1 (0.69) indicating that the population distribution is in the negative side as compared to the population mean. It is indicative dominant nature of the most of the alleles (Figure 6C).
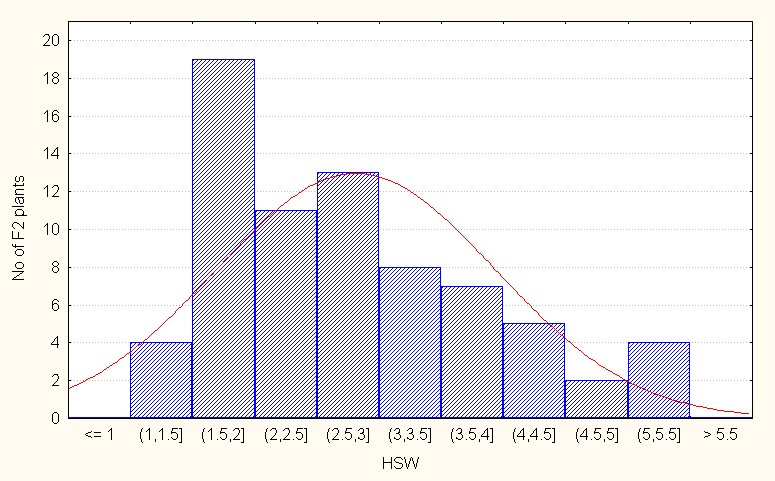
Figure 6C: Interspecific reciprocal crosses.
Figure 6: A-C Frequency distribution for hundred seed weight among F2 segregants
Single plant yield, In the intraspecific crosses, the F2 population recorded a mean value of 7.92 with the maximum value of 22.00 (Table 2). The value of skewness is positive and more than 1. (1.11) indicating that presence of dominant gene action to lesser extent (Figure 7A).
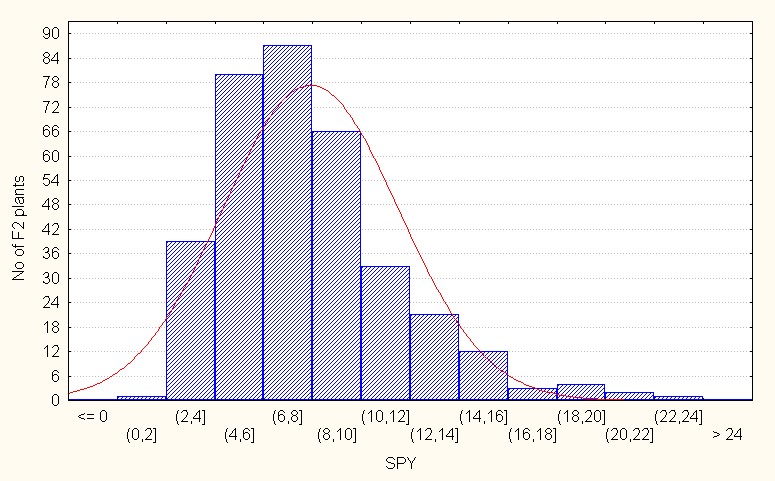
Figure 7A: Intraspecific crosses.
For interspecific direct crosses the population mean was 2.86 with maximum value of 8.52 (Table 3). The skewness is positive and more than 1 (1.18) indicating of additive gene action in the population (Figure 7B).
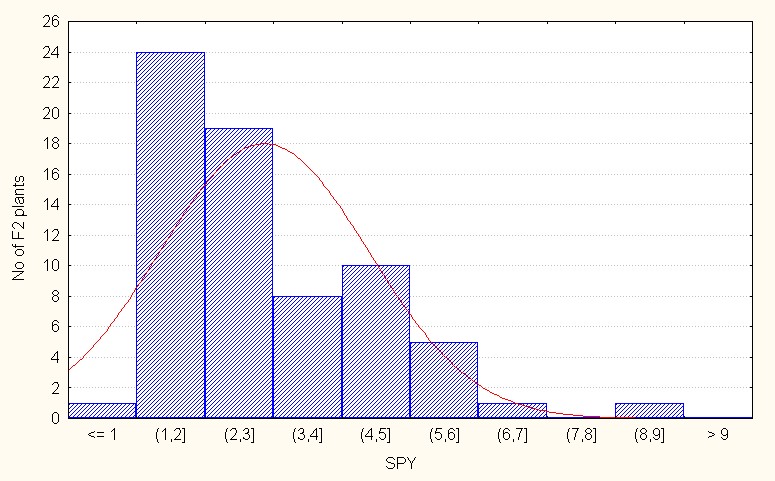
Figure 7B: Interspecifc direct crosses.
Regarding interspecific reciprocal crosses, the population mean was 3.19 with a maximum of 6.90 (Table 4). The skewness value was positive and low (0.44) reflecting presence a few dominant alleles (Figure 7C).
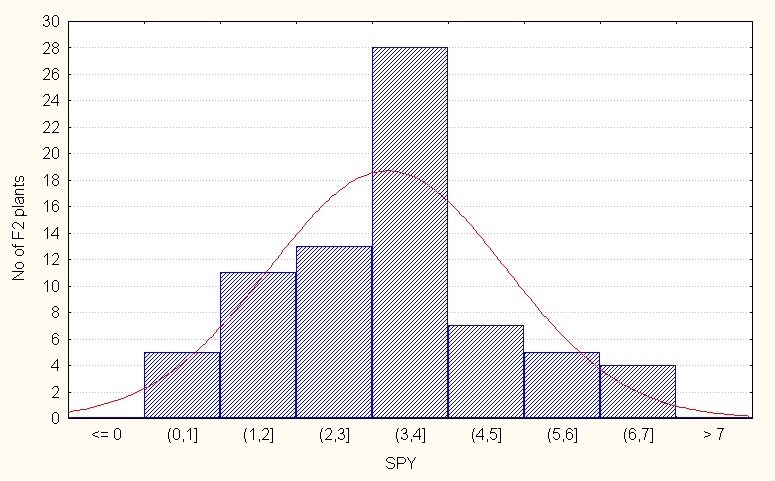
Figure 7C: Interspecific reciprocal crosses.
Figure 7: A-C Frequency distribution for single plant yield among F2 segregants
Discussion
The present investigation included the following aspects. Comparison of variability generated in intraspecific and interspecific F2 population for assessment of their breeding value. Field view for intraspecific crosses (Figure.8). With the objective of the assessing the overall variability generated by the intra and interspecific crosses, the F2 generation frequency distribution graphs were plotted. The data from intra and interspecific F2 segregants for the six highly correlated yield components namely number of branches per plant (Figure 1), length of branch (Figure 2), number of clusters per branch (Figure 3), number of clusters per plant (Figure 4), number of pods per plant (Figure 5) and hundred seed weight (Figure 6) along with seed yield (Figure 7,8) were pooled irrespective of the crosses, for construction of frequency distribution graph. From the frequency graphs it was obvious that the variability generated in the intraspecific F2 population were much higher in magnitude as compared to the direct and reciprocal interspecific crosses. One common feature observed in both the intra and inter specific segregants is the predominance of dominant action for most of the yield components [4-8] This is in agreement with the view of [9,10] that selection of genetically diverse parents resulting in predominance of non-additive genes. By following the strategy of postponement of selection to advanced generations in both the intra and inter specific populations positive results will be achieved.For most of the direct as well as reciprocal crosses, the F2 progenies revealed high per se performance and also exhibited high variability for all the 11 traits. For all the traits in majority of the crosses, the skewness was positive indicating that predominance of dominant alleles as opined by [11,12] and Darbeshwar Roy (2000). In this situation selection for traits in the early generation will not be fixable hence selections in later generations or by adopting modified breeding procedures such as intermating the segregants followed by recurrent selection may shift the gene action towards additive effects. Since sterility factors will gradually reduce over generations in case of interspecific crosses and more recombined populations will be available for selection, the effecting selection in the later generation will be more effective.
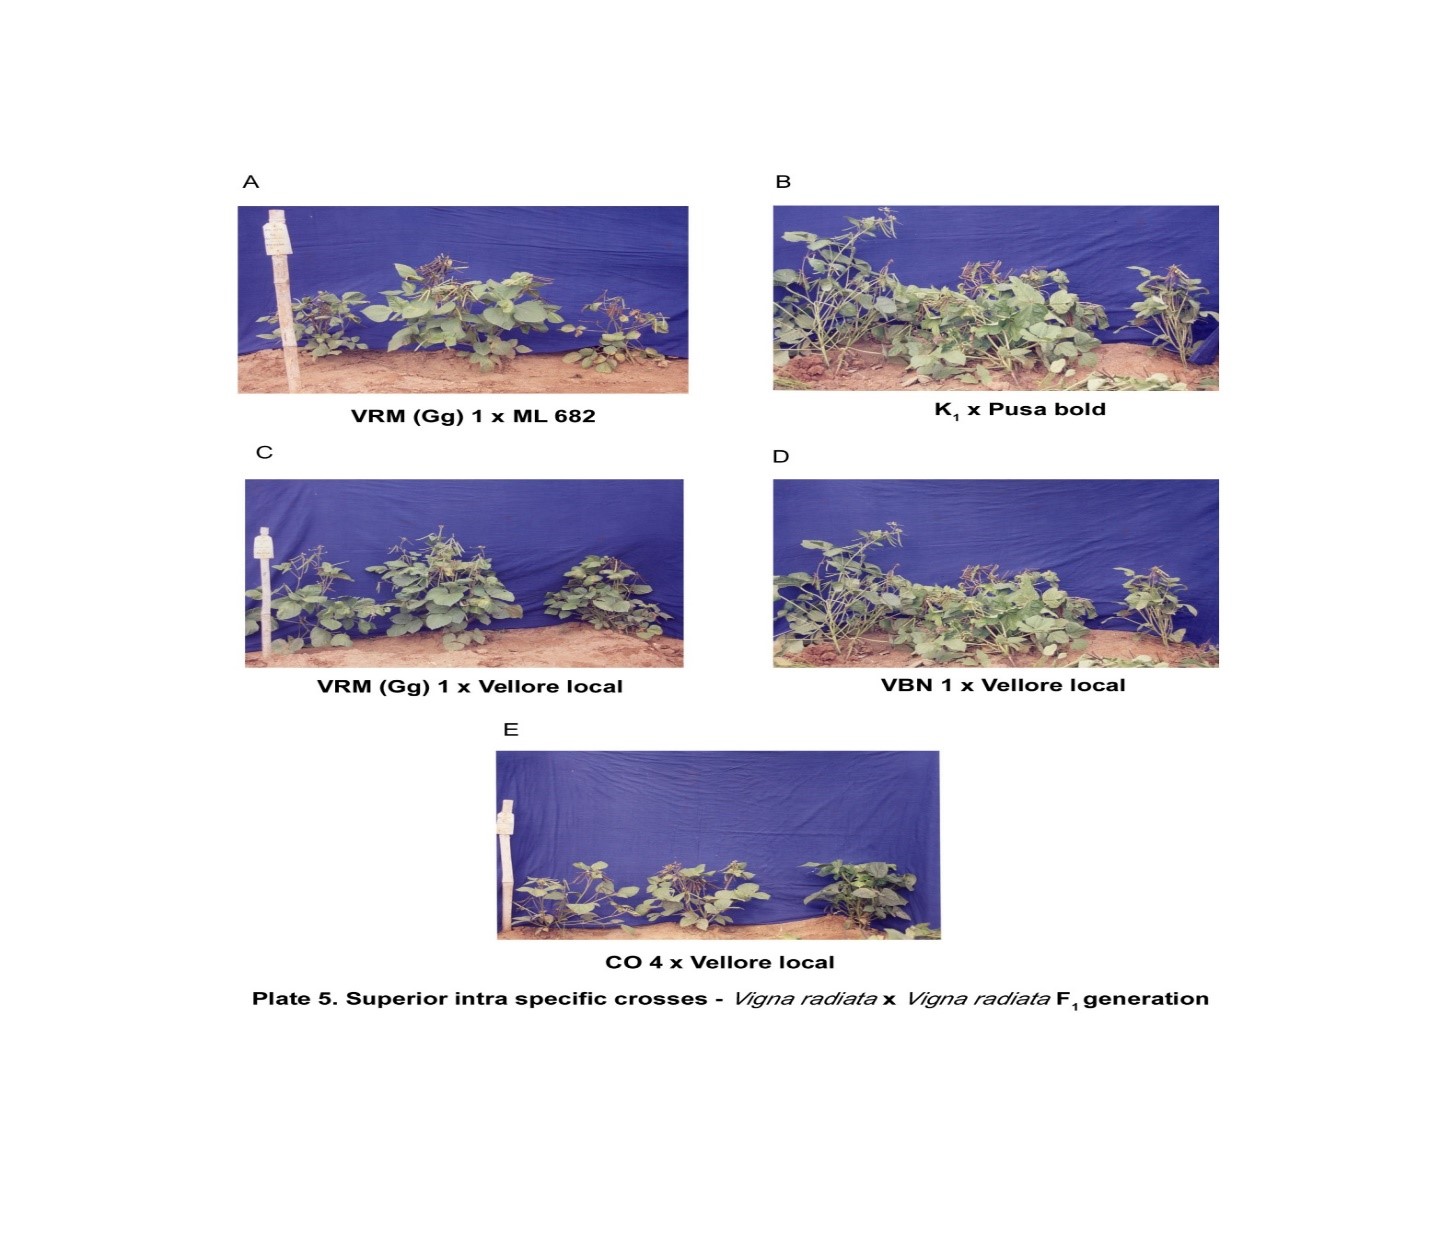
Figure 8: Field view of some intra specific crosses mungbean.
References
1. Baldev B, Ramanujam S, Jain HK, 1988. Cropping patterns. In Pulse Crop (Grain Legumes). Oxford &IBH Publishing Co. 513-557. 2. Sadaphal MN, Baldev B, Ramanujam S, et al. 1988. Agronomy of pulses. In Pulse Crops (Grain Legumes). Oxford & IBH Publishing Co., Pvt Ltd.: 456-512.
3. Frankel OH, Brown AHD. 1984. Plant genetic resources today: a critical appraisal. in Crop Genetic Resources: Conservation & Evaluation (J.H.W. Holden and J.T. Williams, eds.). George Alien & Unwin Ltd., London. 249-257. Ref.: https://bit.ly/2SPVdUQ
4. Pandiyan M, Senthil N, Ramamoorthi N, et al. 2010. Interspecific hybridization of Vigna radiata x 13 wild Vigna species for developing MYMV donar. Electronic Journal of Plant Breeding. 600-610. Ref.: https://bit.ly/35j1I5d
5. Sudha, Karthikeyan1 MA, Anusuya P, et al. 2013. Inheritance of Resistance to Mungbean Yellow Mosaic Virus (MYMV) in Inter and Intra Specific Crosses of Mungbean (Vigna radiata). American Journal of Plant Sciences. 4: 1924-1927
6. Pal SS, Dhaliwal HS. Bains SS. 1991. Inheritance of Resistance to Yellow Mosaic Virus in Some Vigna spp. Plant Breeding.106: 168-171. Ref.: https://bit.ly/2MRPme9
7. Ammavasai S, Phogat DS, Solanki IS. 2004. Inheritance of Resistance to Mungbean Yellow Mosaic Virus (MYMV) in Greengram (Vigna radiata L. Wilczek). The Indian Journal of Genetics. 64: 146.
8. Pandiyan M, Ramamoorthi N, Ganesh SK, et al, 2008. Broadening the Genetic Base and Introgression of MYMV Resistance and Yield Improvement through Unexplored Genes from Wild Relatives in Mungbean. Plant Mutation Reports, 2: 33-43. Ref.: https://bit.ly/2Fj5lxn
9. Khattak GSS, Haq MA, Ashraf M, et al. 2000. Genetic architecture secondary yield components in mungbean (Vigna radiata (L.) Wilczek). Breeding Science, 52: 235-324. Ref.: https://bit.ly/35fJvpa
10. Rao SS, Singh SP, Rao SK. 1984. Estimation of additive, Dominance, Digenic Epistatic interaction effects for yield and its componenets in mung bean (Vigna radiata (L.) Wilczek. Legume Res. 7: 6-12. Ref.: https://bit.ly/2ZJNitQ
11. Fisher RA, Yates F. 1967. Statistical table for biological, agricultural and medical research. Oliver and Boyd. Edinburh.
12. Darbeshwar Roy. 2000. Plant breeding analysis and exploitation of variation. 300- 304.
13. Khattak GSS, Haq MA, Shraf M. et al.2002. Triple test cross analysis for some morphological traits in mungbean (Vigna radiata (L.) Wilczek). Euphytica. 123: 413- 420.