Indexing & Abstracting
Full Text
Research ArticleDOI Number : 10.36811/ijpsh.2019.110012Article Views : 43Article Downloads : 36
Effect of the Soil Amendments on the Physical and Chemical Properties of the Soil under Centre Pivot Irrigation System
Dr. Ibrahim Naser1*, Emiliano Olbinado1, Conrado Angeles2 and Abu Kashem A2
1Previous Address: Research Dept., TADCO, Tabuk 71421, P O Box 808, Saudi Arabia
2Present Address: Laboratory Unit. TADCO, Tabuk 71421, P O Box 808, Saudi Arabia
*Corresponding Author: Dr. Ibrahim Naser, Wadi Seer, P O Box 143285, Postal Code, 11814, Amman, Jordan, Email: ibsn2003@hotmail.com
Article Information
Aritcle Type: Research Article
Citation: Ibrahim Naser, Emiliano Olbinado, Conrado Angeles, Abu Kashem A. 2019. Effect of the Soil Amendments on the Physical and Chemical Properties of the Soil under Centre Pivot Irrigation System. Int J Plant Sci Hor. 1: 106-128.
Copyright: This is an open-access article distributed under the terms of the Creative Commons Attribution License, which permits unrestricted use, distribution, and reproduction in any medium, provided the original author and source are credited. Copyright © 2019; Ibrahim Naser
Publication history:
Received date: 21 September, 2019Accepted date: 04 October, 2019
Published date: 07 October, 2019
Abstract
A field trial was conducted to evaluate the application of four soil amendments: sand, gypsum, cow manure and granular sulfur to improve the soil conditions under center pivot irrigation system to manage the mechanization of potato crop harvest in the autumn of 2012; the application of sand amendment was to facilitate mechanical harvest. Evaluation on the improvement of the soil properties were carried out during the growing season through monitoring the changes on soil texture and structure, saturation percentage, bulk density, soil pH and soil salinity. Clods formation occurred at all of the treatments at the harvest time an indication of negative structure improvement due to field trafficking for soil ridging, and spraying during the growing season. The clods samples contained higher %calcium carbonate and higher level of % (Silt+Clay) and less %sand than normal soil samples. Bulk density in the sand treatment was 1.41 gram/cm3 which was significantly higher than the other treatments which ranged 1.13 - 1.19 gram/cm3. Saturation percentage increased at all of the treatments over the period of the experiment from 21 to 31 an indication of significant improvement on the soil water holding capacity. Salinity as measured by the soil Ec was significantly increased over the period of the experiment due to fertilizer application, and salinity at the cow manure treatment was higher than other treatments due to high salt level in the cow manure which reached an Ec average of 5.57 mS/cm over the period of the experiment. Chloride and bicarbonate levels were high and increased on all of the treatments at most sampling occasions of the trial, and sodium level was within the acceptable level.
Keywords: Soil Amendment; Soil Texture; Saturation Percentage; Bulk Density; Soil Salinity
Soil structure at TADCO and due to many reasons is characterized by the presence of compacted layer about 30 cm below the soil surface and the presence of soil clods [1]. This is a major problem facing the company in their effort towards the mechanization of potato crop harvest without compromising the quality and the yield. Mechanical compaction and low organic matter are the main cause for bad soil structure [2,3]. Common symptoms of bad soil structure are surface crusting, presence of hard-pans and clods in the soil. The results of soil compaction is the restriction of water infiltration, air/oxygen movement and root growth [2,3,4]. Soil amendments are materials added to the soil to improve its physical and/or chemical properties. For soil chemical improvements, soil amendments are used for two main reasons: reduction of soil alkalinity and improvement of water penetration into the soil. Amendments exert their benefit on sodic soils by increasing soluble calcium levels in the soil as soluble calcium replaces sodium on the ex-change complex and provide looser, more friable soil. Examples of soil amendments containing calcium are: gypsum, calcium carbonate (lime)., calcium polysulphide etc.; and the examples of acidifying amendments which release calcium from calcium carbonate in the soil are: sulfur, sulphuric acid, ammonium polysulphide, ammonium thiosulphate etc. [5]. Another purpose of using soil amendments (soil conditioners) in horticulture crops is to improve the soil texture/structure, porosity, water permeability, fertility etc. [6] by the addition of one or more of the following materials: organic compost, sand, peat moss, vermiculate, perlite etc.
This research work was part of TADCO management plan to solve soil compaction and clods problems for potato crop production through the application of soil amendments before potato planting to improve the soil physical and chemical properties under centre pivot irrigation system. Potato growers at Hail region of Saudi Arabia add sand to the top 10 cm layer of the sandy loam soil of the centre pivot to improve the cosmetic appearance of table potato to have a nice smooth skin with no bruises [7], and observations at TADCO on potato crop grown in loamy sand soil shown easier mechanical harvest operations. The type and chemical composition of the soil amendments used to improve the soil conditions vary among different sources. Granular sulfur, gypsum, organic manure and sand were the soil amendments available to the potato growers in Saudi Arabia. The aim of this research work was to evaluate the application of these soil amendments to improve the soil conditions under center pivot irrigation system to manage the mechanization of potato crop harvest.
Materials and Methods
Two pivots J34P85 and F18P35, each 50 Ha, were chosen to test the effect of different soil amendments on the potato crop of autumn 2012 season. The soil amendments treatments were applied at each pivot during the month of August after initial land preparation and before planting potato crop by the 1st week of September. Each soil amendment was applied on each pivot at the following rates:
Location 1 at J34P85:
A. Sand: Spread by grader up to 10 cm surface layer (12.5 Ha) = 1000 M3/Ha.
B. Control 1: (12.5 Ha), no amendment.
C. Control 2: (12.5 Ha), no amendment.
D. Gypsum: (12.5 Ha) 3 M.T/Ha: Purity 85%, particle size 0-1.5mm, spread by fertilizer spreader.
Date of Planting: September 01, 2012 Variety: Diamant
Location 2 at F18P35:
E. Control 3: (12.5 Ha), no amendment.
F. Organic Manure :( 12.5 Ha) = 50 M3/Ha with the following analysis: pH=8.26, Ec=33.3, %P=0.007, %K=0.04, %Ca=0.15, %Mg= 0.04, %Cl=0.04, %Bicarbonate=0.03, spread by fertilizer spreader.
G. Sulfur Granular: (12.5 Ha): Primstone 1 M.T/Ha: Purity 90%, granules 2-4mm, spread by fertilizer spreader.
H. Control 4: (12.5 Ha), no amendment.
Date of Planting: September 03, 2012 Variety: Markies
To study the effect of soil amendments on the soil physical & chemical properties, the lab unit personnel collected representative soil samples of each treatment from a depth 0 - 30 cm before planting potato and then after on monthly basis, they conducted soil analysis for the following tests: soil texture, bulk density, saturation percentage, soil chemicals test including calcium, magnesium, sodium, chloride and bicarbonate on the saturated paste in addition to pH and Ec tests and notes on clods size.
Laboratory Soil Analysis Procedures [8-11]
Preparation of a saturated soil paste:
Equipments:
- Buchner funnel
- Vacuum Pump
Procedure:
After samples were received, spread the soil sample over a plastic sheet, break large soil crumps to improve the drying process and leave it to dry for overnight. The next day sieve the dried soil through 840 mm (20 mesh) sieve. Mix the soil well, weigh about 1000 grams in a bottle and add approximately 150-200 ml of water. Record the weight of the soil and the water used. The weight of the water can be determined either by measuring the volume of water added, or by weighing the bottle + sample after water had been added; from these records the saturation percentage can be calculated. The paste reaches to the saturation point when the following criteria are met: it flows slightly when the container is tipped or it slides cleanly, but slowly from the spatula.
One hour after the paste is prepared, the soil saturation point should be checked again. In case it is too dry, water should be added, if it was too wet soil should be added and note the weight of volume for the calculation of the saturation percentage. The sample should be vacuum filtered 4 to 24 hours after preparation, and the pH of the soil paste should be measured before filtering. Put a medium fast filter into a Buchner funnel and transfer the soil into the funnel. After all the samples have been transferred into the funnel. Turn on the vacuum pump and slowly increase the vacuum. This is to prevent soil particles from slanting through the filter, while filtering. Make sure that there are no air leaks in the paste. If so, fill them with soil using a spatula. Maintain the vacuum until dry cracks appear in the paste. Then turn off the vacuum and carefully allow air to enter. Remove the funnel and transfer the filtrate into a dry and clean container. From this solution all nutrients except Phosphorous can be determined.
pH and EC measurement of the saturated soil paste & it’s Extract:
Equipment: PH & EC Meters
Procedure:
The pH is measured in the saturated paste, before filtration. Calibrate the PH meter with pH 7.00 and pH 4.0 Buffer solutions. Insert the electrode into the paste. This should be done carefully to avoid damaging the membrane of the electrode. After filtering the EC can be measured. No calibration is needed; however, the cell constant has to be checked regularly with a solution of known conductivity (usually 0.01m KCL). Immerse the electrode in the solution and find the correct scale expansion. Record the reading from the EC meter.
Determination of cations by ammonium nitrate extraction method:
Procedure
1) Weigh 5.0g of air-dried sample into a 250ml polythene bottle and add 100 ml ammonium nitrate (1 M) fit a polyethylene screw cap on the bottle and put on the shaker.
2) Shake for 1 hour.
3) Filter the mixture through a whatman 42 filter paper.
4) Transfer 18 ml of extracted soil solution into 2 separate vials and add 1 ml strontium and cesium chloride. These solutions used for the determination of available Ca, Mg, K, & Na using AAS.
5) Determine the concentration of cations using AAS as follows:
ppm Ca, Mg, K, & Na = Observed reading X Dilution factor
Determination of bicarbonate in the Soil:
Procedure:
1) Pipet 2 ml of soil extract into an Erlenmeyer flask.
2) Add 3 drops of methyl red indicator.
3) Titrate with 0.05 normal sulfuric acid until the color changes from yellow to orange
4) Also perform a blank.
Calculation: Meq HCO3 = 1000/P x V X T P = Sample volume
V = Volume of H2SO4
T = Conc. of H2
Determination of chloride in the soil:
Procedure:
1) Add 3 drops potassium chromate to the above solution. The color will change to yellow again.
2) Titrate with 0.05 normal silver nitrate solution until the color first brown color appears.
3) Perform a blank.
Calculation: Meq chloride = 1000/P x V x T
P = Volume of the sample
V= Volume of silver nitrate
T = Conc. of silver nitrate
Determination of Bulk Density:
Procedure
1) Weigh empty metal soil tin with its lead.
2) Take 100 ml of soil sample corrected for moisture content, and determine the volume of the soil sample by water displacement.
3) Put similar 100 ml soil sample in a tin and cover it with the led.
3) Oven dry the soil sample for 24 hours.
4) Place the hot tin inside desiccator and leave it until it become cold.
5) Weigh the closed container and find the weight of the air-dry soil sample.
6) Calculate the soil bulk density as per the following formula:
Determination of Saturation Percentage:
Procedure:
1) Take 100 gram of air-dried soil sample (w1)
2) Dry the soil sample in the oven at 1050C for overnight or use the microwave oven and determine the weight of the sample (w2) when it is stabilized.
3) Add water to the soil sample slowly and mix well until you reach the saturation point, i.e. any excess of water shall come out free of the soil paste.
4) Determine the quantity of the water added to the sample. Let us assume it was 15 ml.
5) Calculate the saturation percentage as follows:
Total water weight for saturating the sample =
[Wt. of water added + Wt. of water in air dry soil] - Weight of oven dry soil
Determination of soil texture:
Soil texture is the relative proportion of sand, silt and clay in the soil, the components of soil particles are:
Sand: particles size 2.0 - 0.05 mm
Silt: particles size 0.05 - 0.002 mm
Clay: particles size is less than 0.002 mm
The lab followed the dispersing analysis method for the determination of soil texture using the reagent (Sodium Hexametaphosphate) for particle size distribution and separated by gravity method with interval of time.
Equipment: Forced Draft Oven
Chemicals:
Sodiummetaphosphate. 26.77 gr. NA4P2O7. 10H2O/Letter.
Hydrochloric Acid. 10% HCL 277/letter.
Steps:
1) Receive a representative soil sample (2 kg) from the field for physical & chemical analysis.
2) Record the soil sample in the log book & label on the sample bag.
3) Spread the soil on the same plastic bag sheet in the drying room.
4) After 1 - 3 days the soil become air dried, break lumps & clods manually if they are present in the sample.
5) Sieve the soil over 2000 μm sieve to get a uniform soil sample & discard the oversize particles: gravel & stones.
6) Collect the soil sample in plastic bag and record the lab. number on the bag and this soil sample is now ready for analysis.
7) Transfer a measured quantity of soil (1-2 gram) to Erlenmeyer Flask to determine the calcium carbonate content in the soil sample.
8) Transfer another measured quantity of soil sample (40-45 gram) to a measuring cylinder for texture analysis & add 10 - 20 ml distilled water.
9) Add a calculated amount of HCL (10%) acid into the cylinder & keep it for 10 - 20 minutes.
10) Add deionized water up to fill the cylinder and stir with wooden or plastic stick and keep it for overnight.
11) Next day decant the water without disturbing the sediment and fill with the fresh deionized water and kept for overnight.
12) Again, next day decant the water and fill with the dispersing agent and water up to 1000 ml, stir and keep it in a safe place.
13) Afternoon collect sample solution (for Silt determination) by pipette into a crucible or small beaker and keep the rest for overnight.
14) Next day collect sample solution (for clay determination) by pipette into another crucible or small beaker.
15) Put the two sample crucibles into the drying oven to evaporate the water portion. After 3-4 hours the dried crucible are taken in a desiccator for cooling and weighing, record the stable reading.
Results and Discussion
The results of the analysis on the soil samples collected from J34P85 and F18P35 pivots on July 28, 2012 from a depth 0-30 cm after initial land preparation and before the application of the soil amendments are represented in Table 1a and Table 1b.
|
Table 1a |
||||||
|
Location |
% Sand |
% Silt |
% Clay |
Soil Texture |
Bulk Density gram/cm3 |
% CaCo3 |
|
J34P85 |
74.0 |
16.75 |
9.25 |
Sandy Loam |
1.13 |
12.6 |
|
F18P35 |
76.5 |
15.5 |
8.0 |
Sandy Loam |
1.17 |
6.6 |
|
Table 1b |
|||||||||
|
Location |
pH (0-14) |
Ec (mS/cm) |
Calcium, ppm
|
Magnesi-um, ppm
|
Potassium, ppm |
Sodium, ppm |
Phosphor-ous, ppm
|
Chloride, ppm |
Bicarbon-ate, ppm |
|
J34P85 |
7.31 |
3.69 |
3893 |
354 |
110 |
269 |
18 |
808 |
366 |
|
F18P35 |
7.26 |
3.37 |
3768 |
259 |
120 |
209 |
24 |
710 |
366 |
|
Acceptable Level |
6.5 - 7.5 |
< 1.7 |
> 1000 |
150 - 250 |
120 - 250 |
< 200 |
10 - 20 |
< 176 |
< 152 |
Results before planting had shown that the soil texture was sandy loamy with salts contents above the acceptable level for potato crop as the Ec reached 3.69, 3.37 mS/cm at J34P85 and F18P35 respectively. The level of sodium was okay, but the level of chloride and bicarbonate salts was high; also, the level of calcium was high. Soil fertility was okay for phosphorous, potassium & magnesium.
Soil compaction [2-4] is the process of increasing bulk density and reducing pore volume as a result of applied pressure on the soil. Heavy equipment traffic and excessive tillage cause soil compaction leading to the deterioration of soil structure. Physical symptoms of compacted soil are the excessive clods formation, presence of hardpan layer below the soil surface and increased soil bulk density. Potato plants are sensitive to the physical conditions of the soil. Compacted soil lead to slow water infiltration and poor plants growth. The results for the effects of soil amendments on the physical and chemical soil properties at the two pivots is presented and discussed as follows.
J35P85 Pivot:
Soil texture [12,13]: It is the relative proportion of sand, silt and clay in the soil. Soil texture profoundly affects soil drainage, water holding capacity, soil fertility and productivity. Soil texture analysis on the soil samples collected from J34P85 on January 17, 2013 at the time of potato harvest when we observed soil clods on the soil surface mixed with potato tubers are presented in Table 2 and Figure 1.
|
Table 2 |
|||||
|
Treatment |
Percentage Soil Content |
%CaCO3 |
Soil Texture |
||
|
%Clay |
%Silt |
%Sand |
|||
|
Sand-Normal |
4.62 |
9.00 |
86.38 |
8.61 |
Loamy Sand |
|
Sand-Clods |
10.38 |
24.12 |
74.50 |
23.46 |
Sandy Loam |
|
Control 1 Normal |
8.62 |
19.00 |
72.38 |
19.6 |
Sandy Loam |
|
Control 1 Clods |
9.00 |
21.00 |
70.00 |
20.64 |
Sandy Loam |
|
Gypsum-Normal |
5.75 |
11.37 |
82.88 |
10.24 |
Sandy Loam |
|
Gypsum-Clods |
10.88 |
24.62 |
64.50 |
24.65 |
Loamy |
|
Control 2 Normal |
9.38 |
19.12 |
71.50 |
12.77 |
Sandy Loam |
|
Control 2 Clods |
9.37 |
19.75 |
70.88 |
13.36 |
Sandy Loam |
|
Soil Sample Before Planting |
9.25 |
16.75 |
74 |
12.3 |
Sandy Loam |
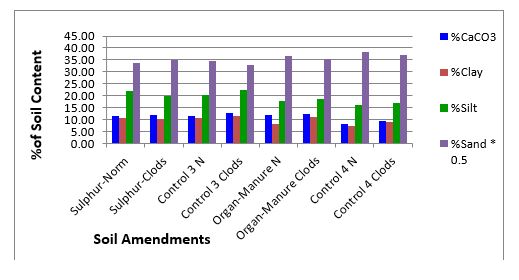
The results showed no significant difference in the soil texture before planting and at the time of harvesting except the texture of soil clods at the gypsum treatment was loamy as it contained more proportions of silt and clay than other treatments. The clods samples contained higher % calcium carbonate and higher level of % (Silt+Clay) and less %sand than normal soil samples,
CaCo3: %Calcium carbonate in the clods was significantly higher than in normal soil, and the difference was more in sand treatment & gypsum treatment.
Sand: %Sand slightly changed in the control samples, but %sand was reduced in the clods of sand treatment and gypsum treatment.
Silt: %Silt was increased in the clod’s samples of sand & gypsum treatments with slight increase in the control.
Clay: %Clay increased in the clod’s samples of sand treatment & gypsum treatment
Figure 1: Column graph representation for the physical and calcium carbonate analysis of the soil samples collected from the different soil amendment treatments at the time of harvest of J34P85.
Soil Structure [4,8]: It refers to the grouping of soil particles sand, silt and clay into aggregates. It is the shape that soil takes based on its physical and chemical properties, soil structure has a major influence on water and air movement, biological activity and root growth. By means of cultivation practices including plowing, the farmer tries to obtain a granular top soil structure for his field. An estimation of the soil clods abundance on the soil surface of J34P85 at the time of potato harvest mixed with potato tubers is shown on Table 3. Soil clods formation at the amendments treatments was an indication of negative soil structure improvement due to field trafficking for soil ridging, field spraying during the growing season; the process of soil improvement would need relatively longer period of time. Ratings for the presence of soil clods shown very high clods density at the control 1 followed by the sand treatment and gypsum treatment with high density then control 2 was relatively with low clods density.
|
Table 3 |
||||
|
Treatment |
Sand |
Control 1 |
Gypsum |
Control 2 |
|
Clods Rating |
++++ |
+++++ |
++++ |
++ |
|
Clods ratings as number of clods/M2: Very High = > 7, (+++++), High = 6 - 7 (++++), Medium = 5 - 6 (+++), Low = 3 - 5 (++), V. Low = < 3 |
||||
Bulk density [14]: It is a measure of soil compaction, strength and porosity, it influences water infiltration and plant root health. Measurements on the bulk density at J34P85 over the period of the growing season are represented on Table 4 and Figure 2.
|
Table 4 |
|||||
|
Treatment |
Bulk Density gram/ cm3 |
Acceptable Level (gram/cm3) |
|||
|
Sept. 15 |
Oct. 8 |
Nov. 12 |
Dec. 30 |
||
|
Sand |
1.43 |
1.45 |
1.35 |
1.41 |
0.5-1.8 |
|
Control 1 |
1.14 |
1.19 |
1.14 |
1.19 |
|
|
Gypsum |
1.18 |
1.19 |
1.12 |
1.17 |
|
|
Control 2 |
1.16 |
1.23 |
1.10 |
1.29 |
|
|
Bulk density before planting: 1.13 (gram/cm3) |
|||||
The results showed the bulk density slightly decreased on all treatments at all dates except the last date on December 30, 2012 it increased slightly. Bulk density in the sand treatment was 1.41 gram/ cm3 which was significantly higher than the control 1, control 2 and the gypsum treatments, see statistical analysis. Bulk density fluctuated slightly over the period of the experiment at all of the treatments except control 2 it was increased. The advantage of the sand amendment application at J34P85 was to facilitate mechanical harvest and to improve soil permeability, but it had lower water holding capacity and lower fertility due to low cation exchange capacity.
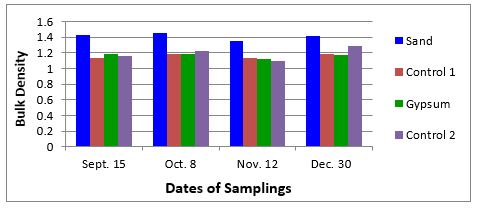
Figure 2: Column graph representation of the bulk density on the soil samples taken from the different soil amendment treatments at J34P85 during the growing season of the potato crop.
The following is the statistical analysis on bulk density of soil samples taken during the course of the experiment at J34P85.
|
Randomized Complete Block AOV Table for bulk density |
|||||
|
Source |
DF |
SS |
MS |
F |
P |
|
Dates |
3 |
0.02063 |
0.00688 |
||
|
Amendments |
3 |
0.16808 |
0.05603 |
46.37*** |
0 |
|
Error |
9 |
0.01088 |
0.00121 |
||
|
Total |
15 |
0.19958 |
|||
|
Grand Mean |
1.2338 |
||||
|
CV |
2.82 |
||||
|
Relative Efficiency, RCB |
1.86 |
||||
|
Means of Bulk Density for the Amendments |
|||||
|
Amendments Mean |
|||||
Saturation Percentage (SP) [15]: It is expressed as grams of water required to saturate 100 grams of dry soil. It is an indication of soil water retention, soil texture and cation exchange capacity. Measurements on the saturation percentage at J34P85 over the period of the growing season are represented on Table 5.and Figure 3. The results showed the saturation percentage in the gypsum treatment was increased over the period of the experiment from 22% to 34.76% an indication of significant improvement on the soil water holding capacity; at both control 1 and 2 there were improvements in the saturation percentage of the soil, and the SP in the control 1 was higher than in the control 2. Little improvement occurred at the sand treatment as the sand is with poor water holding capacity.
|
Table 5 |
|||||
|
Treatment |
Saturation Percentage gram water/100-gram soil |
Saturated Percentage as per soil type |
|||
|
Sept. 15 |
Oct. 8 |
Nov. 12 |
Dec. 30 |
||
|
Sand |
20.00 |
26.93 |
20.67 |
22.48 |
< 20 for sandy or loamy sand soil 20 - 35 for sandy loam soil 35 - 50 for loam or silt loam soil 50 - 65 mm for clay loam soil > 65 clay or peat soil |
|
Control 1 |
23.71 |
27.90 |
26.70 |
31.51 |
|
|
Gypsum |
22.00 |
27.56 |
27.41 |
34.76 |
|
|
Control 2 |
24.00 |
27.44 |
28.42 |
27.41 |
|
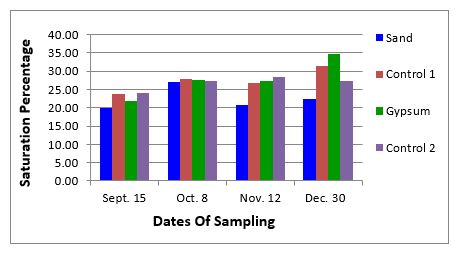
Figure 3: Column graph representation of the saturation percentage of the soil samples taken from the different amendment treatments at J34P85 during the growing season of the potato crop.
The following is the statistical analysis on the saturation percentage of soil samples collected from J34P85 during the course of the experiment.
|
Randomized Complete Block AOV Table for Saturation Percentage |
|||||
|
Source |
DF |
SS |
MS |
F |
P |
|
Dates |
3 |
96.149 |
32.0497 |
||
|
Amendments |
3 |
73.996 |
24.6652 |
3.84* |
0.0506 |
|
Error |
9 |
57.776 |
6.4195 |
||
|
Total |
15 |
227.92 |
|||
|
Grand Mean |
26.181 |
||||
|
CV |
9.68 |
||||
|
Relative Efficiency, RCB |
1.73 |
||||
|
Means of Saturated Percentages for Soil Amendments |
|||||
Soil pH [5]: It refers to the degree of acidity or alkalinity of the soil due to the relative concentrations of hydrogen and hydroxyl ions in the soil solution. Measurements on the pH of the soil samples over the period of the experiment at J34P85 are presented in Table 6 and Figure 4.
The results showed that the pH at the start of the experiment in the sand treatment was the highest with pH value 7.72, while at the gypsum it was the lowest with pH value 7.28; control areas 1 & 2 were with pH 7.31, 7.35 respectively. Over the period of the trial, the pH at the sand treatment continuously decreased, while at the gypsum treatment, control 1 and controls 2 treatments the pH was slightly and steadily increased reaching pH 7.60, 7.50, 7.53 respectively.
|
Table 6 |
|||||
|
Treatment |
pH Value |
Acceptable Level |
|||
|
Sept. 15 |
Oct. 8 |
Nov. 12 |
Dec. 30 |
||
|
Sand |
7.72 |
7.53 |
7.60 |
7.52 |
6.5 - 7.5 |
|
Control 1 |
7.31 |
7.34 |
7.48 |
7.50 |
|
|
Gypsum |
7.28 |
7.35 |
7.40 |
7.60 |
|
|
Control 2 |
7.35 |
7.32 |
7.42 |
7.53 |
|
|
Soil pH value before planting: 7.31 |
|||||
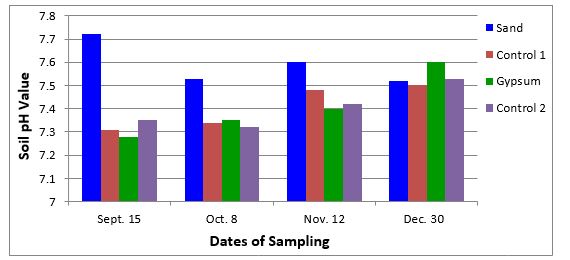
Figure 4: Column graph representation of the soil pH of the soil samples taken from the different amendment treatments at J34P85 during the growing season of the potato crop.
Soil Salinity [5,16]: It refers to soil conditions where water-soluble salts are present in sufficient amounts to affect crop growth. The factors which affect soil salinity are: Ec level and the level of sodium, chloride and bicarbonate.
Soil Ec: It refers to the electric conductivity of the soil solution, it is a measure of soil salinity and is expressed mille Siemens/centimeter (mS/cm). Potato crop is moderately sensitive for soil salts with an Ec level 1.7 - 3 mS/cm. Measurements on the Ec of the soil samples at J34P85 are presented in Table 7a and Figure 5a.
|
Table 7a |
|||||
|
Treatment |
Electric Conductivity mS/cm |
||||
|
Sept. 15 |
Oct. 8 |
Nov. 12 |
Dec. 30 |
Tolerance Level |
|
|
Sand |
1.02 |
1.50 |
2.07 |
3.51 |
1.7 - 3 |
|
Control 1 |
2.80 |
3.04 |
3.76 |
4.57 |
|
|
Gypsum |
3.96 |
3.10 |
4.10 |
2.36 |
|
|
Control 2 |
1.24 |
2.70 |
5.36 |
2.93 |
|
|
The Ec value before planting: 3.69 mS/cm |
|||||
At the start of the trial, the Ec at the gypsum treatment was the highest with Ec 3.96 mS/cm, while at the sand treatment it was the lowest with Ec 1.02 mS/cm followed by control 2 & control 1 with value 1.24, 2.80 mS/cm respectively. Over the period of the trial September to November, the Ec was increased in all of the treatments due to the application of the fertilizers. The Ec decreased in December at the gypsum and control 2, while at sand & control 1 it was continuously increased. The Ec at some occasions was above the acceptable level 1.7 - 3 mS/cm which would have affected potato productivity.

Figure 5a: Column graph representation of the soil Ec of the soil samples collected from the different amendment treatments at J34P85 during the growing season of the potato crop.
Soil sodium: Sodium level on the soil samples of different treatments taken during the course of the experiment is represented on Table 7b and Figure 5b.
|
Table 7b |
|||||
|
Treatment |
Sodium (ppm) |
Tolerance Level (ppm) |
|||
|
Sept. 15 |
Oct. 8 |
Nov. 12 |
Dec. 30 |
||
|
Sand |
73 |
60 |
93 |
136 |
< 230 |
|
Control 1 |
137 |
187 |
153 |
206 |
|
|
Gypsum |
96 |
130 |
148 |
177 |
|
|
Control 2 |
126 |
132 |
159 |
153 |
|
|
Soil sodium level before planting: 269 ppm |
|||||
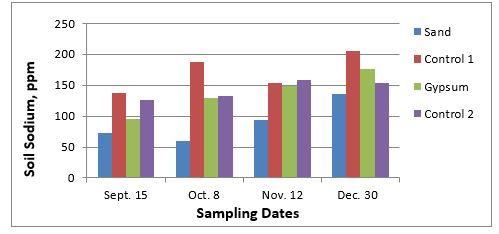
Figure 5b: Column graph representation of sodium on the soil samples collected from the different amendments treatments at J34P85 during the growing season of the potato crop.
At the start of the trial, sodium level at control 1 treatment was the highest which reached 137 ppm, while at the sand treatment it was the lowest with value 73 ppm followed by control 2 & control 1 with value 126, 137 ppm respectively. Over the period of the trial September to December, sodium level slightly increased in all of the treatments but still within the acceptable level for normal potato growth.
Soil Chloride: Chloride level on the soil samples of the different treatments is represented on Table 7c and Figure 5c.
|
Table 7c |
|||||
|
Treatment |
Chloride (ppm) |
Tolerance Level (ppm) |
|||
|
Sept. 15 |
Oct. 8 |
Nov. 12 |
Dec. 30 |
||
|
Sand |
266 |
310 |
443 |
886 |
< 500 |
|
Control 1 |
532 |
753 |
798 |
1064 |
|
|
Gypsum |
399 |
487 |
620 |
753 |
|
|
Control 2 |
931 |
753 |
975 |
576 |
|
|
Soil Chloride Level Before Planting: 808 ppm |
|||||
At the start of the trial, chloride level at control 2 treatment was the highest which reached 931 ppm, while at the sand treatment it was the lowest with value 266 ppm followed by gypsum & control 1 with value 399, 532 ppm respectively. Over the period of the trial September to December, chloride level increased in all of the treatments and this have affected productivity in these areas as it was above 500 ppm.
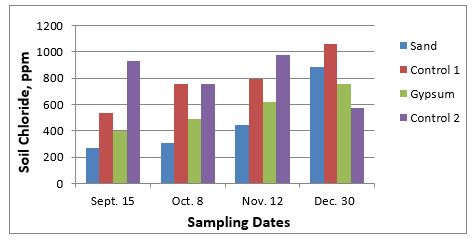
Figure 5c: Column graph representation of chloride on the soil samples collected from the different amendments treatments at J34P85 during the growing season of the potato crop.
Soil Bicarbonate: Bicarbonate level on the soil samples of different treatments taken from J34P85 during the course of the experiment is represented on Table 7d and Figure 5d.
|
Table 7d |
|||||
|
Treatment |
Bicarbonate (ppm) |
Acceptable Level (ppm) |
|||
|
Sept. 15 |
Oct. 8 |
Nov. 12 |
Dec. 30 |
||
|
Sand |
381 |
153 |
229 |
305 |
< 152 |
|
Control 1 |
381 |
305 |
229 |
305 |
|
|
Gypsum |
229 |
381 |
229 |
305 |
|
|
Control 2 |
381 |
229 |
153 |
305 |
|
|
Soil Bicarbonate Level Before Planting: 366 ppm |
|||||
The bicarbonate level at all occasions was high and above the acceptable level for normal potato growth. High bicarbonate level was due to high level of calcium carbonate in the soil & continuous irrigation with water contains relatively high bicarbonate. The application of acid fertilizers through irrigation system during crop growth overcomes this problem.
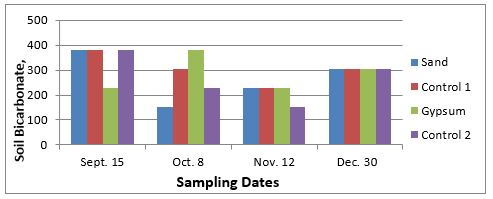
Figure 5d: Column graph representation of bicarbonate on the soil samples collected from the different amendments treatments at J34P85 during the growing season of the potato crop.
F18P35 Pivot:
Soil texture [12,13] was measured by the analysis of the soil samples collected from F18P35 on January 17, 2013 at the time of potato harvest when we observed soil clods on the soil surface mixed with potato tubers, the results are presented in Table 8 and Figure 6.
|
Table 8 |
|||||
|
Treatment |
Percentage Soil Content |
%CaCO3 |
Soil Texture |
||
|
%Clay |
%Silt |
%Sand |
|||
|
Control 3-Normal |
10.62 |
20.5 |
67.38 |
11.77 |
Sandy Loam |
|
Control 3-Clods |
11.75 |
22.62 |
70.14 |
12.66 |
Sandy Loam |
|
Cow Manure-Normal |
8.37 |
18.00 |
68.88 |
11.92 |
Sandy Loam |
|
Cow Manure-Clods |
11.00 |
18.50 |
65.6 |
12.36 |
Sandy Loam |
|
Sulfur-Normal |
10.62 |
22.00 |
73.62 |
11.77 |
Sandy Loam |
|
Sulfur-Clods |
10.12 |
19.75 |
70.5 |
12.06 |
Sandy Loam |
|
Control 4-Normal |
7.50 |
16.00 |
76.5 |
8.19 |
Sandy Loam |
|
Control 4-Clods |
8.87 |
17.00 |
74.12 |
9.34 |
Sandy Loam |
|
Soil Sample before planting |
8.0 |
15.5 |
76.5 |
6.6 |
Sandy Loam |
The comparative results showed no significant difference in the soil texture before planting and at the time of harvesting, we also observed the following:
CaCo3: %Calcium carbonate in the clods samples was slightly higher than in normal soil samples at all locations
Sand: %Sand in the clods was slightly less than in normal soil samples except at control 3 it was slightly higher.
Silt: %Silt in the clods was slightly higher than in normal soil samples except at sulfur it was slightly less.
Clay: %Clay in the clods was slightly higher than in normal soil except at sulfur it was slightly less.
Results showed that soil clods samples contained higher %CaCo3 and higher % (silt + clay) than normal soil samples.
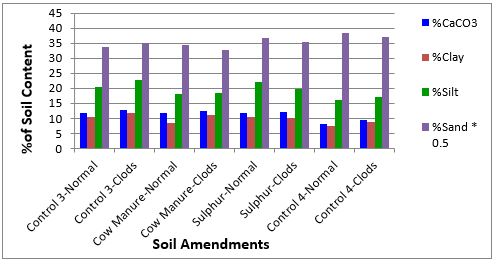
Figure 6: Column graph representation for the physical analysis and calcium carbonate analysis of the soil samples collected from the different soil amendment treatments at the time of harvest of F18P35.
Soil structure [4,8] at the different treatments was measured by the estimation of the soil clods abundance on the soil surface of F18P35 at the time of potato harvest mixed with potato tubers, see Table 9. Ratings for the presence of soil clods shown very high clods density at control 3 followed by the cow manure treatment with high clods density; clods density at the sulfur treatment was low and very low at control 4. These differences indicate different soil structure at these locations. Soil clods formation at the amendments treatments was an indication of negative soil structure improvement due to field trafficking for soil ridging, field spraying during the growing season.
|
Table 9 |
||||
|
Treatment |
Control 3 |
Cow Manure |
Granular Sulfur |
Control 4 |
|
Clods Rating |
+++++ |
++++ |
++ |
+ |
|
Clods ratings as number of clods/M2: Very High = > 7 (+++++), High = 6 - 7 (++++), Medium = 5 - 6 (+++), Low = 3 - 5 (++), V. Low = < 3 |
||||
Measurements on the bulk density [14] of soil samples taken from the different amendments at F18P35 during the growing season are represented on Table 10 and Figure 7.
|
Table 10 |
|||||
|
Treatment |
Bulk Density gram/cm3 |
Acceptable Level |
|||
|
Sept. 15 |
Oct. 8 |
Nov. 12 |
Dec. 30 |
||
|
Control 3 |
1.20 |
1.19 |
1.15 |
1.16 |
0.5 - 1.8 |
|
Cow Manure |
1.10 |
1.12 |
1.12 |
1.16 |
|
|
Sulfur |
1.15 |
1.19 |
1.18 |
1.21 |
|
|
Control 4 |
1.18 |
1.21 |
1.13 |
1.20 |
|
|
Bulk density before planting: 1.17 gram/cm3 |
|||||
Bulk density was almost the same at the start of the trial and ranged from 1.1 - 1.20 gram/cm3 and it fluctuated around the same range over the period of the experiment, so there was no significant effect of the soil amendments at this pivot on bulk density.
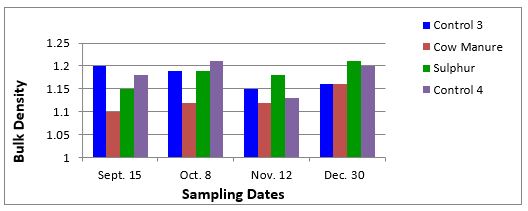
Figure 7: Column graph representation of the bulk density on the soil samples collected from the different soil amendment treatments at F18P35 over the period of the growing season.
Measurements on the saturation percentage [15] of soil samples taken from the different amendments at F18P35 during the growing season are represented on Table 11 and Figure 8. At the start of the trial, bulk density was almost the same and ranged from 1.1 - 1.20 gram/cm3; it fluctuated around the same range over the period of the experiment, so there was no significant effect of the soil amendments at this pivot on bulk density. Saturation percentage increased at all of the treatments over the period of the experiment from 21 to 31 an indication of significant improvement on the soil water holding capacity, and no significant difference was observed between the control and the treatments of sulfur and organic manure.
|
Table 11 |
|||||
|
Treatment |
Saturation Percentage gram water/100 gram soil |
Saturated Percentage as per soil type |
|||
|
Sept. 15 |
Oct. 8 |
Nov. 12 |
Dec. 30 |
||
|
Control 3 |
21.91 |
27.31 |
27.08 |
31.34 |
< 20 for sandy or loamy sand soil 20 - 35 for sandy loam soil 35 - 50 for loam or silt loam soil 50 - 65 mm for clay loam soil > 65 clay or peat soil |
|
Cow Manure |
21.00 |
28.83 |
30.38 |
31.36 |
|
|
Sulfur |
20.98 |
26.64 |
27.84 |
30.37 |
|
|
Control 4 |
21.98 |
27.26 |
29.71 |
30.37 |
|
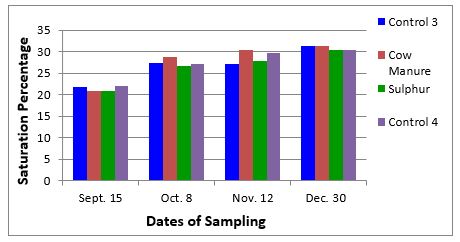
Figure 8: Column graph representation of the saturation percentage on the soil samples collected from the different soil amendment treatments at F18P35 during the growing season.
Meaurements on the pH [5] of the soil samples taken during the course of the experiment at F18P35 is represented in Table 12 and Figure 9.
|
Table 12 |
|||||
|
Treatment |
Sept. 15 |
Oct. 8 |
Nov. 12 |
Dec. 30 |
Acceptable Level |
|
Control 3 |
7.50 |
7.38 |
7.48 |
7.56 |
6.5 - 7.5 |
|
Cow Manure |
7.70 |
7.63 |
7.42 |
7.83 |
|
|
Sulfur |
7.50 |
7.40 |
7.40 |
7.53 |
|
|
Control 4 |
7.37 |
7.44 |
7.60 |
7.68 |
|
|
Soil pH before planting: 7.26 |
|||||
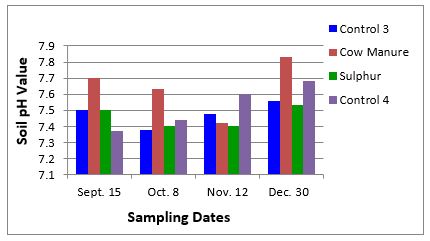
Figure 9: Column graph representation for the soil pH of the soil samples collected from the different soil amendment treatments at F18P35 during the growing season.
At the start of the experiment, pH at the organic manure treatment was the highest with pH value 7.70, while at the control 4 it was the lowest with pH value 7.37. Sulfur treatment & control 3 were with similar pH value of 7.50. Over the period September to November of the trial, the pH at all the treatments except control 4 continuously decreased an indication of soil improvement, while at control 4 it was slightly and steadily increased reaching pH 7.68 by the end of the trial. .
Measurements on the soil salinity [5,16] by measuring the Ec of the soil samples collected from F18P35 during the growing season is presented in Table 13a and Figure 10a.
|
Table 13a |
|||||
|
Treatment |
Ec mS/cm |
Tolerance Level mS/cm |
|||
|
Sept. 15 |
Oct. 8 |
Nov. 12 |
Dec. 30 |
||
|
Control 3 |
1.92 |
2.19 |
3.76 |
3.77 |
1.7 - 3 |
|
Cow Manure |
3.67 |
6.21 |
5.32 |
7.10 |
|
|
Sulfur |
1.94 |
3.75 |
4.10 |
3.23 |
|
|
Control 4 |
3.00 |
2.95 |
2.07 |
2.88 |
|
|
Soil Ec before planting: 3.37 mS/cm |
|||||
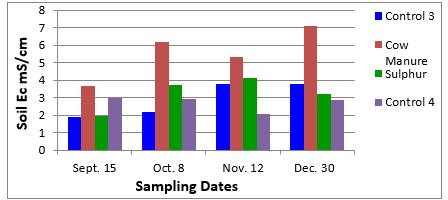
Figure 10a: Column graph representation for the soil Ec of the soil samples collected from the different soil amendment treatments at F18P35 during the growing season.
The soil Ec of F18P35 at the start of the trial was the highest on the organic manure treatment with Ec value 3.67 followed by control 4 with Ec value 3.00, while the Ec at control 3 & Sulfur treatment was the lowest with Ec value 1.92, 1.94 respectively. Over the period of the trial, the Ec was significantly increased in the organic manure treatment due to the combination of high salt level in the organic manure and fertilizer application which reached 7.10 by the end of the trial; and at the Sulfur and control 3 it increased to a less extent due to fertilizer application. The Ec value at control 4 slightly and continuously decreased during the period of crop growth, and by the end of the trial in December it was slightly increased to reach 2.88.
The sodium level of the soil samples collected from the different amendment treatments at F18P35 during the growing season of the potato crop is presented in Table 13b and Figure 10b.
|
Table 13b |
|||||
|
Treatment |
Sodium (ppm) |
Tolerance Level |
|||
|
Sept. 15 |
Oct. 8 |
Nov. 12 |
Dec. 30 |
||
|
Control 3 |
99 |
102 |
142 |
202 |
< 230 |
|
Organic Manure |
163 |
221 |
187 |
275 |
|
|
Sulfur |
145 |
130 |
154 |
183 |
|
|
Control 4 |
129 |
128 |
180 |
163 |
|
|
Soil sodium before planting: 209 ppm |
|||||
At the start of the trial, sodium level at the organic manure treatment was the highest which reached 163 ppm, while at the control 3 treatment it was the lowest with value 99 ppm followed by control 4 & sulfur treatments which reached 129 , 145 ppm respectively and all are within the acceptable range for normal plant growth. Over the period of the trial September to December, sodium level slightly increased in all the treatments but still within the acceptable level for normal potato growth except at the organic manure treatment which reached 275 ppm. Sodium level appeared in relatively higher concentration in organic manure treatment by the end of the trial due to high salt level in the organic manure and the continuous mixing of the organic fertilizer with the soil through irrigation water over the period of the experiment.
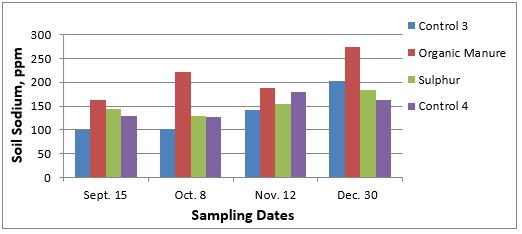
Figure 10b: Column graph representation of the sodium level on the soil samples collected from the different soil amendment treatments at F18P35 during the growing season.
The chloride level at F18P35 during the growing season of the potato crop is presented in Table 13c and Figure 10c. At the start of the trial, chloride level at the organic manure was the highest and it reached 753 ppm, while at the control 3 treatment it was the lowest with value 433 ppm followed by sulfur, control 4 with value 487, 620 ppm respectively. Over the period of the trial September to December, chloride level increased on all of the treatments as it reached the range 753 - 1640 ppm and this have affected productivity in this pivot.
|
Table 13c |
|||||
|
Treatment |
Chloride (ppm) |
Tolerance Level (ppm) |
|||
|
Sept. 15 |
Oct. 8 |
Nov. 12 |
Dec. 30 |
||
|
Control 3 |
443 |
355 |
886 |
931 |
< 500 |
|
Organic Manure |
753 |
1535 |
1429 |
1640 |
|
|
Sulfur |
487 |
931 |
1152 |
753 |
|
|
Control 4 |
620 |
576 |
1329 |
620 |
|
|
Soil chloride before planting: 710 ppm |
|||||
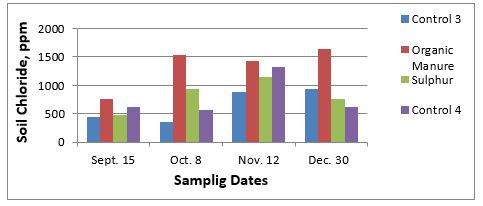
Figure 10c: Column graph representation of the chloride level on the soil samples collected from the different soil amendment treatments at F18P35 during the growing season.
The soil bicarbonate level at F18P35 during the growing season of the potato crop is presented in Table 13d and Figure 10d.
|
Table 13d |
|||||
|
Treatment |
Bicarbonate (ppm) |
Acceptable Level (ppm) |
|||
|
Sept. 15 |
Oct. 8 |
Nov. 12 |
Dec. 30 |
||
|
Control 3 |
305 |
229 |
153 |
305 |
< 152 |
|
Organic Manure |
381 |
267 |
229 |
305 |
|
|
Sulfur |
229 |
305 |
229 |
229 |
|
|
Control 4 |
381 |
229 |
153 |
305 |
|
|
Soil bicarbonate before planting: 366 ppm |
|||||
The bicarbonate level at most of the occasions was high and above the acceptable level for normal potato growth as it ranged from 153 - 381 ppm. High bicarbonate level was due to high level of calcium carbonate in the soil and due to continuous irrigation with water contains relatively high bicarbonate. The application of acid fertilizers through the irrigation system during crop growth partially solved this problem.
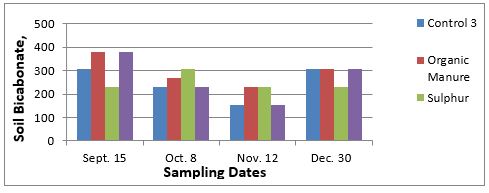
Figure 10d: Column graph representation of the bicarbonate level on the soil samples collected from the different soil amendment treatments at F18P35 during the growing season.
Summary and Conclusions- The comparative results at the two pivots showed no significant difference in the soil texture before planting and at the time of harvesting as all were with sandy loam texture except the texture of soil clods at the gypsum treatment was loamy which contained more proportions of silt and clay than other treatments.
- At both pivots, the clods samples contained higher %calcium carbonate, higher % (silt + clay) and less sand than normal soil samples.
- One growing season for the amendments treatments was not enough to show positive results on the soil structure and prevent soil clods formation at the time of harvest as this occurred due to field trafficking for soil ridging, field spraying during the growing season and the process of soil improvement would need relatively longer period of time.
- The comparative results at the two pivots showed no significant difference in the soil bulk density before planting and at the time of harvesting at all of the quarters except sand treatment which increased to 1.41 gram/cm3.
- The sand amendment treatment did not improve the soil fertility and water-holding capacity, but it helped for easier mechanical harvest as per field observations.
- Saturation percentage at both pivots was improved at all quarters except sand amendment, and the SP for the gypsum treatment was the highest as the SP increased over the period of the experiment from 22% to 34.76% an indication of significant improvement on the soil water holding capacity.
- Salinity as measured by the soil Ec at both pivots was significantly increased over the period of the experiment due to fertilizer application, but it decreased on December before harvest. Salinity at the Gypsum, control 2, and control 4 was improved, while the soil salinity at the other quarters it was continuously increased and reached above the acceptable level which would have affected productivity. The Ec at the organic manure treatment was significantly increased over the period of the experiment due to the combination of fertilizer application and high salt level in the organic manure which reached 7.10 by the end of the trial. So, the rate of application should be reduced to be not more than 10 M3/Ha.
Acknowledgment
The authors wish to thank TADCO CEO, Eng’r Saad Al Swat, Dr Abdul Monim Ali (CBDO) and Eng’r Ali Omer (COO) for their continuous support during this study. We appreciate the help of the Admin. Asst. Mr. Isaac Obra for typing the lab reports and arranging the drawing.
References
1. Voss RE. 2013. A report to TADCO, Summary of Observations, and Suggestions/Recommendations, consultancy visit. 1-7.
2. Mckenzie RH. 2010. Agricultural soil compaction: causes and management. Ref.: https://bit.ly/2oogZ57
3. USDA, Soil compaction symptoms, causes, correction, and prevention. 2008.
4. Phogat VK, Tomar VS, Dahiya R. 2015. Soil physical properties. 135-171. Ref.: https://bit.ly/2pcAePj
5. FAO. Sodic soils and their management, a companion volume to soils bulletin No. 31 ‘Prognosis of salinity and alkalinity’ published in 1976. Ref.: https://bit.ly/2nKGgX9
6. Davis JG and Whitinng D. Choosing a Soil Amendment, Sheet # 7.235. Clorado State University. Ref.: https://bit.ly/2mOnLk2
7. Sand amendments for the improvement of potato production in Hail region, Saudi Arabia 2007. Ref.: http://www.alriyadh.com/288082
8. Anonymous. 2012. Features of soil in: Soils and Soil Physical properties, Department of primary industries. Ref.: https://bit.ly/2on9USk
9. Chapman HD, Pratt PF. 1961. Methods of Analysis for soils, plants and water. University of California, Division of Agricultural Science, Berkeley, CA, USA.
10. Benton Johns J. 1999. Soil Analysis Handbook of Reference Methods. CRC Press New York.
11. Benjamin Wolf. 1996. Diagnostic Technique for Improving Crop Production, Food product Press, Hartworth Press Inc. New York.
12. FAO, Soil Texture. 1998. Ref.: https://bit.ly/2mTg9wM 13. FAO. Physical properties of the soil, Food and Agriculture Organization. Ref.: https://bit.ly/2nHUYOC
14. 14.Brown K. 2019. Bulk density-Measurement. Ref.: https://bit.ly/2ot7x01
15. Peacock B. 1988. The Use of Soil and Water Analysis. University of California, Tulare County, Cooperative Extension, Pub. 96.
16. Ayers RS, Westcot DW. 1985. Water Quality for Agriculture, FAO, Paper # 29, Rev.1(f). Arnold E. Greenberg, Lenore S. Clesceri & Andrew D. Eaton. Standard Methods for the Examination of Water and Waste Water.


