
-
Mail us:
editor@raftpubs.org
Indexing & Abstracting
Full Text
Research ArticleDOI Number : 10.36811/ijbm.2019.110017Article Views : 21Article Downloads : 28
Simultaneous EEG-fMRI: A novel approach to localize the Seizure Onset Zone
Elias Ebrahimzadeh1*, Sana Amoozegar2, Mostafa Asgarinejad3, Mohammadjavad Rahimi Dolatabad4, Mahmoud Bagheri5 and Morteza Zangeneh Soroush6
1CIPCE, School of Electrical and Computer Engineering, College of Engineering, University of Tehran, Tehran, Iran
2Department of Biomedical Engineering, Faculty of Engineering, Shahed University, Tehran, Iran
3Institute for Cognitive Sciences Studies, Tehran, Iran
4Department of Mechanical and Mechatronics Engineering, Sharif University of Technology, International Campus, Kish, Iran
5Department of Medical Physics and Biomedical Engineering, Research Center for Molecular and Cellular in Imaging, School of Medicine, Tehran University of Medical Science, Tehran Iran
6Department of Biomedical Engineering, Science and Research Branch, Islamic Azad University, Tehran, Iran
*Corresponding Author: Elias Ebrahimzadeh, PhD, CIPCE, School of Electrical and Computer Engineering, College of Engineering, University of Tehran, North Kargar Ave., Tehran, Iran, Emails: e_ebrahimzadeh@ut.ac.ir; elias.ebrahimzadeh@ucalgary.ca
Article Information
Aritcle Type: Research Article
Citation: Elias Ebrahimzadeh, Sana Amoozegar, Mohammadjavad Rahimi Dolatabad, et al. 2019. Simultaneous EEG-fMRI: A Multimodality Approach to Localize the Seizure Onset Zone in Patients with Epilepsy. Int J Biol Med. 1: 130-139.
Copyright: This is an open-access article distributed under the terms of the Creative Commons Attribution License, which permits unrestricted use, distribution, and reproduction in any medium, provided the original author and source are credited. Copyright © 2019; Elias Ebrahimzadeh
Publication history:
Received date: 25 November, 2019Accepted date: 02 December, 2019
Published date: 04 December, 2019
Abstract
Affecting daily lives of millions of people, Epilepsy is a common central nervous system (neurological) disorder where cell activity in brain is disturbed, causing recurrent seizures. Epilepsy can be treated commonly by medications. Be that as it may, medications do not always work as well as one may have hoped, and thus, some patients tend to resort to surgeries. The primary challenge in such surgeries, and by extension any other surgery where some part of brain may need to be disabled, disconnected or removed, is managing to pose no threat to the critical healthy textures adjacent or close to the part being operated on. Therefore, the precise localization of epileptic focus is a matter of vital importance in treating this condition. Various algorithms have been proposed to localize the brain sources and thus to determine the epileptic focus, however, none has yet been able to offer a solution to effectively address this issue. With EEG signal containing temporal information and fMRI carrying spatial information, it is hoped that the combination of the two can yield optimal results. In this case study, we first remove the artifacts caused by EEG gradients, and proceed to study the signal in and outside the scanner by localizing the brain sources. The simultaneous processing of EEG-fMRI enables us to make use of the temporal information in EEG to analyze fMRI. Epileptic foci are finally localized based on GLM method. This study has been conducted on 2 medication-resistant patients with epilepsy whose data was recorded in Iran National Brain Mapping Centre. The results suggest a significant improvement in localization accuracy compared to existing methods in the literature.
Keywords: Simultaneous EEG-fMRI; Epilepsy; Independent Component Analysis (ICA); Blood-oxygen-level dependent imaging (BOLD); Generalized Linear Model (GLM)
Introduction
An appreciation of the propagation of epileptic activity is key to understanding the basis of networks that underpin epilepsy. EEG-fMRI can localise the haemodynamic correlates of interictal epileptiform discharges (IEDs). EEG and fMRI are known to complement one another in the spatiotemporal representation of brain activity as each method has its strengths where the other has limits. Thus, the simultaneous recording and analysis of EEG and fMRI brings about a higher prospect of understanding the reality of neural behaviors. This method is now increasingly available after crucial technical challenges have been resolved in terms of developing suitable amplifiers and procedures for correcting the scanner-related artifacts in the EEG signal [1-8].
EEG-fMRI combines the high temporal resolution of EEG signal with the high spatial resolution of blood oxygen level dependent (BOLD) MRI. Studies [9-11] looked into the spike-related BOLD changes and showed that in addition to characterizing different types of focal and generalized epilepsy, these measures could also improve the presurgical evaluation of patients with refractory focal seizures.
When it comes to focal epilepsy, particularly in pharmacoresistant patients and surgical candidates, a matter of substantive significance is how the spike-related BOLD changes can help localize the epileptic focus. It has been shown that the BOLD signal tends to increase in regions generating focal IEDs [12], although mostly in the form of widespread responses [13]. Moller et al. [11] demonstrated that the simultaneous acquisition and analysis of EEGfMRI aided in localizing foci in patients with nonlesional frontal lobe epilepsy, as confirmed by other imaging modalities. Also, in [14], desirable results were achieved in a postoperative population when the resection was ensured to include the BOLD activation region [14]. Thornton et al. [14] reported seizure freedom rates of as high as 60% in patients who had undergone surgical resections in which cortical tissues with maximal IEDcorrelated BOLD changes were completely removed.
Taken together, a growing body of the current literature points to the significant role of EEGfMRI recordings in clinical decision making: [10] finds that the Bold response is in accordance with the IED field in 88% of the patients and also shows that EEG-fMRI contributes noticeably to localizing the seizure focus in 64% of the studied patients. In patients who deemed ineligible for surgery based on conventional analyses, EEG-fMRI improved localization in four of six patients with unclear foci and confirmed multifocality in four of five presumed multifocal patients [15].
Conventionally, identifying the epileptic regions begins with marking IEDs, which are believed to be one of the primary indicators of epileptogenic tissues [16]. This is done by trained experts through visually inspecting the EEG simultaneously recorded with fMRI. The time series of the detected IEDs are then convolved with the hemodynamic response function and an analysis following a General Linear Model (GLM) is performed to estimate the hemodynamically active regions. Finally, the regions that cross a certain statistical threshold are considered as markers of the epileptogenic zone (EZ).
It is now possible to combine EEG and fMRI in the study of epileptic disorders, and therefore to determine the region of the brain in which there is a change in the BOLD signal as a result of an epileptic discharge seen on scalp EEG, wherever that change takes place in the brain. One can hypothesize that this region is where the spike originates, in a similar way that single photon emission computed tomography (SPECT) studies are performed at the time of epileptic seizures to determine the regions of increased blood flow [17,18].
We will present the methods that have been developed for recording and analyzing the EEG in the MR scanner, the methods required to analyze the BOLD signal resulting from epileptic discharges, and results from studies of different types of epileptic disorders. Finally, we will discuss the advantage of the proposed method compared to conventional methods.
Materials and Methods
Subjects
The simultaneous EEG-fMRI scanning was performed at the National Brain Mapping Laboratory (NBML) in Tehran, Iran, from two patients with epilepsy.
The patients were selected based on the following inclusion criteria: 1) diagnosed with focal or generalized epilepsy and a surgery candidate; and 2) at least 10 IEDs that can be distinctly identified during the MRI scanning, i.e., there is a sufficient number of IEDs detectable on EEG (often one IED every 2 minutes). The recruited patients consists of 1 male and 1 female; age 26 and 38 years; the onset age of 5 and 16 years. All patients provided written informed consent and ethical approval was obtained from the local ethics committee of Iran University of Medical Sciences, Tehran, Iran.
To have the Seizure Onset Zone (SOZ) and irritative zone (IZ) localized in the preoperative evaluation, we employed a wide range of techniques including a comprehensive clinical record study, full neurological examination, long term Video-EEG, structural MRI, neuropsychological assessment, and other non-invasive investigations such as PET and ictal SPECT when available. This procedure was performed at Epilepsy Center, Pars Hospital, Tehran, Iran.
EEG-fMRI recording
Simultaneous EEG-fMRI was recorded inside a 3T MRI scanner (Siemens Prisma) for 20 min at rest with eyes closed. A 64-channel MRI-compatible EEG cap was used according to the 10–20 system (reference Cz); ECG was recorded using a single lead [19]. EEG was also recorded for 10 min with eyes closed outside the scanner immediately prior to EEG-fMRI scanning [19]. Electrodes were equipped with an additional 5 kΩ resistance and impedances were kept as low as possible. EEG was acquired at 5 kHz using BrainAmp MRI-compatible amplifiers (Brain Products) and EEG was synchronized with the MRI clock.
A T1 MPRAGE anatomic acquisition was done (1 mm slices, 256×256 matrix, echo time [TE]=3.74 ms, repetition time [TR]=1810 ms, flip angle=30°) and used to superimpose functional images. Functional data was obtained in 20 minutes runs with patients at rest, using a T2*-weighted gradient-echo (GRE) imaging sequence (234×234 matrix, 40 slices, 3×3× 3 mm, TE=26 ms, TR=2500 ms, flip angle=60°). The patient’s head was immobilized with a pillow filled with foam microspheres to minimize movement and provide comfort [20,21].
EEG Signal Processing
The preprocessing of EEG signals is accomplished using the EEGLAB toolbox (available at https://sccn.ucsd.edu/eeglab/). Initially, the sampling rate is reduced from 5000 HZ to 250 Hz and the baseline drift, which contains the low frequency components, is suppressed through a Butterworth high-pass filter at 1 Hz [22-35]. The channels are then reviewed to identify and remove abnormal channels, i.e., those with a p-value greater 0.01. The power line interference, containing high frequency components, is removed using the Clean Line algorithm [36-38], which is vastly superior to a notch filter in terms of retaining the main content of the signal. It adaptively estimates and removes sinusoidal artifacts, while unlike the notch filter, does not create band-holes in the EEG power spectrum. A primary challenge in interpreting simultaneous EEG-fMRI recordings is the gradient artifact caused by the switching of the magnetic fields. To tackle this, we employ the fMRIb algorithm [39] which first increases the sampling rate to 20 kHz, then applies a low-pass filter at 60 Hz. The EEG recordings are also heavily contaminated by Ballistocardiogram (BCG) artifact, associated with cardiac pulsations causing movements of the electrodes, which will also be removed through fMRIb toolbox.
An experienced neurophysiologist manually searched for each type of intra-MRI spikes in each patient. Spikes were modeled as zero-duration events, convolved with a standard HRF, and used as a regressor for the GLM model and fMRI analysis.
BOLD signal Processing
We use FSL software to perform motion correction (realignment with 6-parameter rigid-body transformation) and smoothing (6-mm full width at half-maximum) on GRE images. Temporal autocorrelations are corrected with an autoregressive model of order one [40], and low-frequency drifts are modeled with a third-order polynomial. The traditional spike-based model uses the time and duration of each event to build an IED-specific regressor and convolves it with spike related hemodynamic response function, whereas, the current study proposes to convolve the independent component time series with 4 HRF peaking at 3,5,7, and 9 seconds [1]. All components are included in the same general linear model (GLM). A statistical t map is obtained for each component using the other components as confounds.
EEG-fMRI analysis
To be prominent, a response requires 5 contiguous voxels having a t-value of 3.1 corresponding to a p-value smaller than 0.05, corrected for multiple comparisons due to the number of voxels and the 4 hemodynamic response functions. We illustrate the t-map results using a red-yellow scale for positive BOLD changes, i.e., activation, and a blue-white scale for negative BOLD changes, i.e., deactivation. We take no notice of responses which are outside of the brain parenchyma. Two experts review the IED-related BOLD responses. For each patient, the analysis proceeds as follows.
Results
The patients with active EEG during acquisition show at least 1 IED type; 1 type (first patient), 2 types (second patient). Thus, for each patient with each type, one source is identified, making a total of 3 EEG-fMRI recordings to be analyzed by the proposed EEG-fMRI method.
In both two patients, at least one IED-related BOLD response is concordant with the spike field (Figure 1,2). The concordant responses are focal in both two patients with focal discharges. In patients, the maximum t-value corresponds to an activation in one of them patients (Figure 1,2) and a deactivation in another one.
In one of the 3 IED-type, the BOLD response is not concordant with the spike field. This subject with left posterolateral frontal and left parietal discharges show no BOLD response at the location of the interictal discharges. However, a BOLD response is observed in the bilateral parietal cortices with maximum Z-score in the contralateral parietal region (poor concordance). This patient did not undergo surgical resection due to poor clinical localization of the seizure focus.
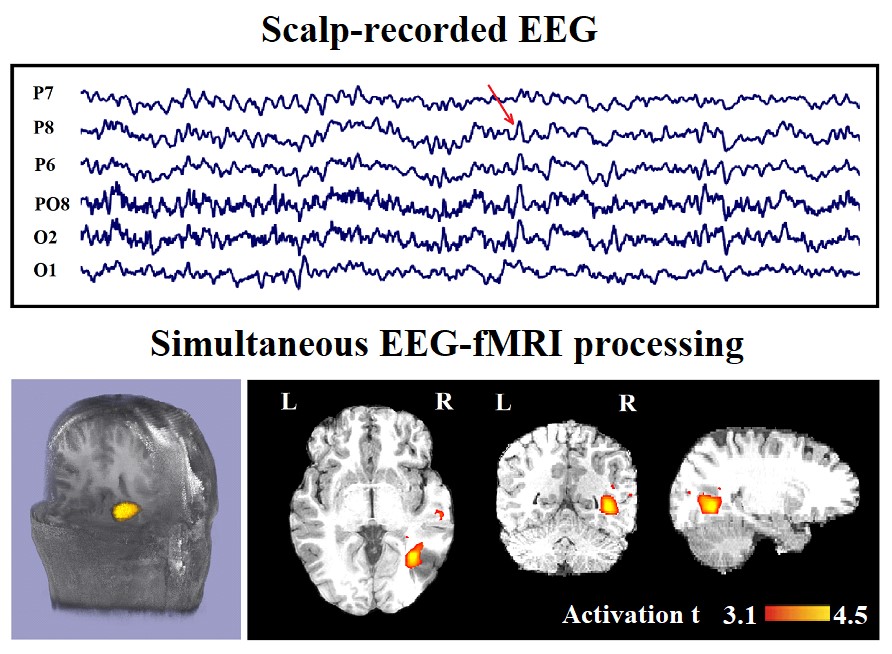
Figure 1: Marked events are P8, PO8, and P6 spikes (referential montage) and the IED-related BOLD response shows a neocortical activation in the first occipito-temporal cortex. This response is considered both concordant with the spike field and contributory because it leads to a better localization of the epileptic focus compared with the scalp EEG. Top, marked scalp EEG in the mentioned channels. Bottom, Localization of the generator applying simultaneous analysis of EEG-fMRI. The active area is marked with a yellow-red color.

Figure 2: Marked events are F7, F5, and F3 spikes (referential montage) and the IED-related BOLD response shows a neocortical activation in the left dorsolateral prefrontal cortex. This response is considered concordant with the spike field but not contributory because it does not add any new information to the scalp EEG. Top, marked scalp EEG in the mentioned channels. Bottom, Localization of the generator applying simultaneous analysis of EEG-fMRI. The active area is marked with a yellow-red color.
As mentioned, in this paper, we investigate the spatial distribution of spike-related and IED-related BOLD changes. Table 1 presents a systematic comparison between our obtained results and similar works. The proposed method improves the concordance between BOLD changes and spike field to 89% which marks a rise compared to another works.
|
Table 1: Comparison of the epileptic foci identification methods through simultaneous EEG-fMRI recording |
|||||||
|
Author; Year |
MRI scanner |
Imaging |
Slice thickness |
TR/TE |
FOV |
Flip angle |
Accuracy |
|
F. Pittau et al. ;2012 [41] |
3-T, Trio; Siemens, Germany |
T1-weighted |
1-mm slices |
23/7.4 ms |
256×256 |
30° |
67% (Generalized) 55% (Focal)
|
|
T2*-weighted 6-min |
33 slices, 3.7 ×3.7×3.7 |
1900/25 ms |
64×64 |
90° |
|||
|
A. Sierra?Marcos et al. ;2013[42] |
1.5-T, General Electric, USA |
T2*-weighted 11-min |
20 slices, 5×5×5 mm |
2000/34 ms |
64×64 |
- |
64% |
|
3-T Magnetom Trio; Siemens, Germany |
T2*-weighted 11-min |
40 slices, 3×3×3 mm |
2000/16 ms |
128×128 |
- |
86% |
|
|
Our method |
3-T MRI; siemens prisma,German |
T1-mprage |
1-mm slices |
1810/3.47 ms |
256×256 |
30° |
89% |
|
T2*-weighted 20-min |
40 slices, 3×3×3 mm |
2500/26 ms |
234×234 |
90°
|
|||
Discussion
Using the proposed method, we not only succeed in incorporating all the temporal information in regard to the identified generators of epileptic activity, but also manage to avoid being misled by extraneous or incomplete information and mistakenly recognizing an irrelevant source as a generator.
Achieving concordant results from various localization methods can be a promising tool when planning surgical resection or intracranial EEG electrode placement. Much of the motivation to combine EEG and fMRI measurements originates from selective information each modality embodies.
The IED-related BOLD response was observed in all patients who had IEDs during the EEG-fMRI acquisition: 2 of 3 IED-study making 67% of the whole, which is higher than that reported in [10] and in [43, 44] which were 57% and approximately 55%, respectively. Moreover, previous EEG-fMRI studies reported detection of IED-related BOLD changes in 50-60% and 60-70% of the patients with spike-triggered or continuous EEG-fMRI, respectively [45]. The literature also brings into light the possibility of increasing the EEG-fMRI yield to 80-90% through using multiple HRFs peaking at 3, 5, 7, and 9 s to calculate the convolutions [1,10]. It has been well-established that neuroelectrical activity and the corresponding hemodynamic response of the physiological and pathological brain function do not overlap precisely. Thus, when investigating the correlation between the two, the literature generally accepts a concordance within 20 mm [38-40], making focal the BOLD change a regional marker of epileptogenic networks at macroscopic scale which proves its usefulness in the evaluation process prior to placing EEG electrodes or performing surgery. In this case study, we have applied complementary physiological information, to identify and introduce the most relevant components. Increasing the yield of EEG-fMRI studies, the proposed method can identify the components responsible for epileptic activity over a specified period of time regardless of spike occurrence inside the scanner. It goes without saying that if there actually are any detectable spikes, they can help facilitate the process, nevertheless, this method will not be dependent on the existence of spikes inside the scanner, although it should be highlighted that this is not the sole accomplishment of this method, rather an additional benefit. From a clinical point of view, a spike-independent analysis can be of immense importance, as it is quite rare that spontaneous epileptiform discharges coincidently occur during simultaneous recordings, making the EEG-fMRI an additional valuable tool for localizing the epileptogenic zone.
Funding
This research did not receive any specific grant from funding agencies in the public, commercial, or not-for-profit sectors.
Acknowledgments
Authors wish to express their gratitude to the Cognitive Science and Technologies Council, Tehran, Iran for their tremendous support.
References
1. Hao Y, Khoo HM, von Ellenrieder N, et al. 2018. DeepIED: An epileptic discharge detector for EEG-fMRI based on deep learning. NeuroImage: Clinical. 17: 962-975. Ref.: https://bit.ly/37L7kYo
2. Morano A, Carnì M, Casciato S, et al. 2017. Ictal EEG-fMRI study of vertiginous seizures. Epilepsy Behav. 68: 51-56. Ref.: https://bit.ly/2Dsix2a
3. Ebrahimzadeh E, Soltanian-Zadeh H, Araabi BN. 2018. Localization of Epileptic Focus Using Simultaneously Acquired EEG-FMRI Data. Computational Intelligence in Electrical Engineering (ISEE). 9: 15-28. Ref.: https://bit.ly/35KMR4i
4. Ebrahimzadeh E, Shams M, Fayaz F, et al. 2019. Soltanian-Zadeh,” Quantitative determination of concordance in localizing epileptic focus by component-based EEG-fMRI. Computer Methods and Programs in Biomedicine. 177: 231-241. Ref.: https://bit.ly/34vGpOj
5. Mirbagheri M, Hakimi N, Ebrahimzadeh E, et al. 2019. Enhancement of optical penetration depth of LED-based NIRS systems by comparing different beam profiles. Biomedical Physics & Engineering Express. 5. Ref.: https://bit.ly/2R0tArl
6. Ebrahimzadeh E, Soltanian-Zadeh H, Araabi BN, et al. 2019. Localizing epileptic focus through simultaneous EEG-fMRI recording and automated detection of IED from inside-scanner EEG. Iranian Journal of BioMedical Engineering (IJBME). Ref.: https://bit.ly/35IISoM
7. Ebrahimzadeh E, Soltanian-Zadeh H, Araabi BN, et al. 2019. Component-related BOLD response to localize epileptic focus using simultaneous EEG-fMRI recordings at 3T. Journal of Neuroscience Methods. 322: 34-49. Ref.: https://bit.ly/2rzoKXu
8. Maziero D, Velasco TR, Salmon CE, et al. 2018. Two-Dimensional Temporal Clustering Analysis for Patients with Epilepsy: Detecting Epilepsy-Related Information in EEG-fMRI Concordant, Discordant and Spike-Less Patients. Brain topography. 31: 322-336. Ref.: https://bit.ly/2L5jn9b
9. Kay B, Szaflarski JP. 2014. EEG-fMRI contributions to our understanding of genetic generalized epilepsies. Epilepsy & Behavior. 34: 129-135. Ref.: https://bit.ly/2Oxdune
10. Pittau F, Dubeau F, Gotman J. 2012. Contribution of EEG-fMRI to the definition of the epileptic focus. Neurology. 78: 1479-1487. Ref.: https://bit.ly/2XUlZMs
11. Moeller F, Tyvaert L, Nguyen D, et al. 2009. EEG-fMRI Adding to standard evaluations of patients with nonlesional frontal lobe epilepsy. Neurology. 73: 2023-2030. Ref.: https://bit.ly/33vx87J
12. Bénar CG, Gross DW, Wang Y, et al. 2002. The BOLD response to interictal epileptiform discharges. Neuroimage. 17: 1182-1192. Ref.: https://bit.ly/37Mn9hn
13. Kobayashi E, Bagshaw AP, Bénar CG, et al. 2006. Temporal and extratemporal BOLD responses to temporal lobe interictal spikes. Epilepsia. 47: 343-354. Ref.: https://bit.ly/33rsx6h
14. Thornton R, Laufs H, Rodionov R, et al. 2010. EEG correlated functional MRI and postoperative outcome in focal epilepsy. Journal of Neurology, Neurosurgery & Psychiatry. Ref.: https://bit.ly/2XUDe0b
15. Zijlmans M, Huiskamp G, Hersevoort M, et al. 2007. EEG-fMRI in the preoperative work-up for epilepsy surgery. Brain. 130: 2343-2353. Ref.: https://bit.ly/34r3NfP
16. Noachtar S, Borggraefe I. 2009. Epilepsy surgery: a critical review. Epilepsy & Behavior. 15: 66-72. Ref.: https://bit.ly/34vGXUt
17. Newton MR, Austin MC, Chan JG, et al. 1993. Ictal SPECT using technetium-99m-HMPAO: methods for rapid preparation and optimal deployment of tracer during spontaneous seizures. J Nucl Med. 34: 666-670. Ref.: https://bit.ly/37La1cs
18. Berkovic SF. 2000. SPECT: neurobiology of periictal blood flow alterations. Adv Neurol. 83: 33-39. Ref.: https://bit.ly/2L7jbGG
19. Vulliemoz S, Carmichael DW, Rosenkranz K, et al. 2011. Simultaneous intracranial EEG and fMRI of interictal epileptic discharges in humans. Neuroimage. 54: 182-190. Ref.: https://bit.ly/33yW91v
20. Ebrahimzadeh E, Soltanian-Zadeh H, Araabi BN, et al. 2018. Localizing Epileptic Focus Through Simultaneous EEG-fMRI Recording and Automated Detection of Interictal Epileptiform Discharges (IED) from EEG in Inside MRI”, 25th National and 3th International Iranian Conference on Biomedical Engineering (ICBME 2018). 1-6. Ref.: https://bit.ly/2OYe9x6
21. Soroush MZ, Maghooli K, Setarehdan SK, et al. 2019. Emotion recognition through EEG phase space dynamics and Dempster-Shafer theory. Medical Hypotheses. 127: 34-45. Ref.: https://bit.ly/2P0BeQ2
22. Ebrahimzadeh E, Foroutand A Shams M. et al. 2019. An optimal strategy for prediction of sudden cardiac death through a pioneering feature-selection approach from HRV signal. Computer Methods and Programs in Biomedicine. Ref.: https://bit.ly/2L63Aad
23. Ebrahimzadeh E, Fayaz F, Nikravan M, et al. 2018. Towards an Automatic Diagnosis System for Lumbar Disc Herniation: The Significance of Local Subset Feature Selection. Biomedical Engineering: Applications, Basis and Communications. 30: 1850044. Ref.: https://bit.ly/2OSnQgF
24. Ebrahimzadeh E, Kalantari M, Joulani M, et al. 2018. Prediction of Paroxysmal Atrial Fibrillation: A Machine Learning Based Approach Using Combined Feature Vector and Mixture of Expert Classification on HRV Signal. Computer Methods and Programs in Biomedicine. 165: 53-67. Ref.: https://bit.ly/37NFieV
25. Ebrahimzadeh E, Fayaz F, Ahmadi F, et al. 2018. Linear and nonlinear analyses for detection of sudden cardiac death (SCD) using ECG and HRV signals. Trends in Medical Research. 1. Ref.: https://bit.ly/37MCG0T
26. Ebrahimzadeh E, Fayaz F, Ahmadi F, et al. 2018. A machine learning-based method in order to diagnose lumbar disc herniation disease by MR image processing. MedLife Open Access. 1. Ref.: https://bit.ly/2OXnWU3
27. Ebrahimzadeh E, Manuchehri MS, Amoozegar S, et al. 2018. A Time Local Subset Feature Selection for Prediction of Sudden Cardiac Death from ECG Signal. Medical & Biological Engineering & Computing. 56: 1253-1270. Ref.: https://bit.ly/34r5JVD
28. Ebrahimzadeh E, Araabi BN. 2016. A Novel Approach to Predict Sudden Cardiac Death Using Local Feature Selection and Mixture of Expert. Computational Intelligence in Electrical Engineering. 7: 15-32. Ref.: https://bit.ly/2rxdcEb
29. Nikravan M, Ebrahimzadeh E, Izadi MR, et al. 2016. Toward a computer aided diagnosis system for lumbar disc herniation disease based on MR Imaging analysis. Biomedical Engineering: Applications, Basis and Communications. 28: 1650042. Ref.: https://bit.ly/2qTYgje
30. Ebrahimzadeh E, Pooyan M, Jahani S, et al. 2015. ECG signals noise removal: Selection and optimization of the best adaptive filtering algorithm based on various algorithms comparison. Biomedical Engineering: Applications, Basis and Communications. 27: 1-13. Ref.: https://bit.ly/33Bi2xy
31. Ebrahimzadeh E, Pooyan M, Bijar A. 2014. A Novel Approach to Predict Sudden Cardiac Death (SCD) Using Nonlinear and Time-Frequency Analyses from HRV Signals. Plos one Journal. 9. Ref.: https://bit.ly/34vSrXL
32. Ebrahimzadeh E, Alavi SM, Bijar A, et al. 2013. A Novel Approach for Detection of Deception Using Smoothed Pseudo Wigner-Ville Distribution (SPWVD). J Biomedical Science and Engineering. 6: 8-18. Ref.: https://bit.ly/33wuoXF
33. Ebrahimzadeh E, Pooyan M. 2011. Early detection of sudden cardiac death by using classical linear techniques and time-frequency methods on electrocardiogram signals. J Biomedical Science and Engineering. 4: 699-706. Ref.: https://bit.ly/37Jz7IF
34. Ebrahimzadeh E, Alavi SM, Samsami khodadad F. 2013. Implementation and Designing of Lie-Detection System Based on Electroencephalography (EEG). Annals of Military and health Science Research. 11: 20-26. Ref.: https://bit.ly/2L3LqWF
35. Ebrahimzadeh E, Pooyan M. 2013. Prediction of Sudden Cardiac Death (SCD) by Using Time-Frequency Domain Methods and Nonlinear Analysis from ECG Signals. Computational Intelligence in Electrical Engineering. 3: 15-26.
36. Amoozegar S, Pooyan M, Ebrahimzadeh E. 2013. Classification of Brain Signals in Normal Subjects and Patients with Epilepsy Using Mixture of Experts. Computational Intelligence in Electrical Engineering. 4: 1-8. Ref.: https://bit.ly/2DrPxaP
37. Ebrahimzadeh E, Alavi SM. 2013. Identification of Deception Through Implementation and Designing of Brain Lie-Detection System. Passive Defense Quarterly.
38. Mirbagheri M, Hakimi N, Ebrahimzadeh E, et al. 2019. Simulation and in vivo investigation of LED-NIR Gaussian beam profile. Journal of Near Infrared Spectroscopy. Ref.: https://bit.ly/37NJECH
39. Worsley KJ, Liao C, Aston J, et al. 2002. A general statistical analysis for fMRI data. Neuroimage. 15: 1-15. Ref.: https://bit.ly/2qUHGQp
40. Pittau F, Dubeau F, Gotman J. 2012. Contribution of EEG/fMRI to the definition of the epileptic focus. Neurology. 78: 1479-1487. Ref.: https://bit.ly/2Dq5FJI
41. Sierra?Marcos A, Maestro I, Falcón C, et al. 2013. Ictal EEG?fMRI in localization of epileptogenic area in patients with refractory neocortical focal epilepsy. Epilepsia. 54: 1688-1698. Ref.: https://bit.ly/37NGSxn
42. Al?Asmi A, Bénar CG, Gross DW, et al. 2003. fMRI Activation in Continuous and Spike?triggered EEG–fMRI Studies of Epileptic Spikes. Epilepsia. 44: 1328-1339. Ref.: https://bit.ly/2Rc1dXt
43. Salek-Haddadi A, Diehl B, Hamandi K, et al. 2006. Hemodynamic correlates of epileptiform discharges: an EEG-fMRI study of 63 patients with focal epilepsy. Brain research. 1088: 148-166. Ref.: https://bit.ly/2Oux3N0
44. Mulert C, Lemieux L. 2009. EEG-fMRI: physiological basis, technique, and applications: Springer Science & Business Media. Ref.: https://bit.ly/35NK9Lp