
-
Mail us:
editor@raftpubs.org
Indexing & Abstracting
Full Text
Review ArticleDOI Number : 10.36811/gjcee.2021.110011Article Views : 122Article Downloads : 69
A survey on the service quality of launch terminal in Bangladesh based on customers satisfaction
Md. Ali Ashraf*, Ashik Mazumder, Md. Shariar Rahman Sumon, Md. Saddam Hossain and Anika Nowshin Mowrin
Department of Civil Engineering, Stamford University, Bangladesh
*Corresponding Author: Md. Ali Ashraf, Department of Civil Engineering, Stamford University, Email: aliashraf.aa712@gmail.com
Article Information
Aritcle Type: Review Article
Citation: Ali Ashraf, Ashik Mazumder, Shariar Rahman Sumon, et al. 2021. A survey on the service quality of launch terminal in Bangladesh based on customers satisfaction. Glob J Civil Environ Eng. 3: 27-38.
Copyright: This is an open-access article distributed under the terms of the Creative Commons Attribution License, which permits unrestricted use, distribution, and reproduction in any medium, provided the original author and source are credited. Copyright © 2021; Ali Ashraf
Publication history:
Received date: 07 June, 2021Accepted date: 11 June, 2021
Published date: 14 June, 2021
Abstract
Quality of the service and effectiveness of service operations system are considered as important aspects of achieving the customers' satisfaction of any service organization. Since it is considered as the low cost, safe and enjoyable travelling method by the passengers, it is need of the hour to identify the customer satisfaction towards the development of transport service methods in the Bangladesh especially in Launch Service. The major objective of this study is to identify the impact of inland transport service quality on passengers' satisfaction. The present study has been attempted to understand and examine the factors influencing the passenger’s satisfaction in the Launch Service. The study is exploratory in nature and used factor analysis to identify the foremost significant factors of Passenger’s satisfaction with service quality. By questionnaire survey we put our survey into five category those are tangibility, reliability, responsiveness, assurance, empathy (24 type question). Also, we took a part in photography survey. From photography and questionnaire survey we made a data and put that data into analysis. By analysis the data we made some pie chat and find a result. Though the satisfaction level is not good. From the result it is shown that bollard quality, dock railing system, mooring ropes quality, staff accommodation; those four parts of the launch terminal is very poor. Although bollard quality, cleanliness, dock to dock joint, snapback zone, watchtower service; those five parts of launch terminal is poor. Also, the docking system, lighting system, loading and unloading system, security system for passenger’s, hawker’s volume, terminal maintenance is average; those five parts of launch terminal is good. It is disappointing to say that there isn’t any canteen facility for the passengers. The rest of the part of the launch terminal is good. We also recommended some suggestion which improvement could make a far better passenger’s satisfaction.
Keywords: Service Quality; Service Variables; Launch Terminal; Structural Equation Modeling
Introduction
Bangladesh is a riverine country with a high population density. Numerous rivers crisscross the country and play an essential role in passenger and cargo transportation. Ferry service, cargo carriers, and petroleum carriers are three major types of inland river connectivity. Bangladesh's economy relies heavily on riverine transportation. Accidents do happen while operating various types of watercraft along riverine pathways, and they have varying degrees of impact on human lives, the environment, and property. Accidents have a wide range of consequences, from minor injuries to fatalities, and from little property damage to serious environmental, property, and human life loss. According to UNCTAD STAD, Bangladesh's GDP increased by 8.06 percent in 2019 and trade in transport services increased by 15878 million current US$. In addition, international trade in waterways transport services increased by 10.3% in 2019 [1]. A basic demand for establishing an effective transportation system is to reduce reliance on private vehicles and increase use of public transportation. To promote a specific mode of public transportation, the service quality that influences mode selection must be increased. Inland waterways, among other public transportation networks, have played a significant role in passenger transportation in subcontinental countries. As a result, the impact of service variables on passenger perceptions of service quality is an essential research topic for service providers, regulatory agencies, and transportation planners looking to improve ferry service quality. Inland waterways play an important role in Bangladeshi culture and will continue to do so for a long time. Bangladesh's waterways total 2400 kilometers, with a passable route of 5,968 kilometres during the monsoon season and 3,865 kilometres during the dry season. Bangladesh's economy relies heavily on riverine transportation. Mishaps do happen while operating various types of watercraft along riverine pathways, and these accidents have varying degrees of impact on human lives, the environment, and property. Accidents have a wide range of consequences, from minor injuries to fatalities, and from little property damage to serious environmental, property, and human life loss. The basic goal of every accident investigation is to provide decision makers with accurate and reliable information so that they may make better decisions to prevent accidents from happening again.
In the 1980s, the Nordic School established the concept of service quality, which was quickly adopted in North America [2]. Service quality is a factor that influences traveler decisions in the passenger transportation business. It is defined as the user's opinion of how well a service fulfils or exceeds expectations. Because users are the sole judges of service quality, service quality is largely measured from their perspective. The most popular way for capturing users' impressions is through a user survey, in which users are asked to assess a specific service characteristic on a specified scale. However, asking consumers to evaluate or comment on a service variable might occasionally result in inaccurate estimate. Furthermore, research reveal that passengers' perceptions of Service Quality change when they express their thoughts on a previously unconsidered service variable. Passengers rate services in a variety of ways that are not always correlated with the frequency with which they are used. Aside from that, different consumers assess the same level of public transportation service quality differently, and their perceptions are influenced by many service variables. Furthermore, passengers' assessments of service variable ratings may not always reflect reality, as there is always the possibility of latent variables that users are unaware of. As a result, approaches to assess the true influence of service factors on perceived service quality must be developed in order to remedy all of these oversights and identify the essential variables of the delivered service.
The proposed study aims to assess the service quality of passenger ferries using a method for assessing and implementing service quality. As a result, we use a passenger satisfaction survey that can be quantified and converted into a variety of quantitative characteristics. Ferry has placed a greater emphasis on passenger satisfaction in recent decades. As a result, passenger satisfaction evaluation is now regarded as the most credible feedback, as it gives passengers' preferences and expectations in an effective, direct, meaningful, and objective manner. In this way, passenger satisfaction serves both a benchmark for performance and a potential benchmark for excellence for the Ferry System. Furthermore, passenger satisfaction gives all passengers participating in any level of the passenger service process a sense of achievement and accomplishment. As a result, satisfaction measurement pushes users to use the platform and provide better service.
Literature Review
The general understanding of the Launch Terminal Facilities is covered in this section. It gives you a broad perspective of current knowledge, helping you to spot pertinent ideas, methodologies, and research gaps. The concept of quality has become obvious as the transportation business has developed. This research looks at the quality of the launch terminal in terms of passenger satisfaction. Data from travelers utilizing the Sadarghat ferry terminal was collected and evaluated using survey questionnaires. The relevant theories are discussed in this section.
As previously stated, academic research has not adequately covered service quality measurement, despite the fact that achieving quality in product and service has been a core marketing priority in the last two decades (Frankel, 1993). Nonetheless, a number of useful research in the marine and other industries are discussed in the following sections. The sadarghat launch terminal was redesigned in that paper (Anika Mahjabin, 2015). A design was created based on the other ferry terminal and the sadarghat terminal. This research was used to calculate the number of pontons and other facilities. This also took into account alternate uses of the area when it was available. Many more functions are added by (Lobo and Jain, 2002) to the existing terminal, which is insufficient to manage such a large number of passengers (Alder and Berechman, 2012). Most notably, capacity is increased proportional to passenger number. The structure holds a variety of events and activities, such as warehouses, a mosque, and a school. The Terminal function adds public functions, which have restricted access, but the public layers are exposed to anyone. They are dedicated to travellers (especially those who have been waiting for a long period) as well as the general public. The terminal will be more than just a terminal; it will also serve as a gathering spot and a leisure area for all. It is best to monitor a port as a multi-layered entity and evaluate (Slack, 1985) both the external and internal elements impacting port activity within its immediate as well as wider environment in order to research the effectiveness of a port as well as the complete port system within a maritime state. Maritime-passenger ports (D'Este and Meyrick, 1992) are one of the important prerequisites for the development of traffic, tourism, and economic activities with the goal of providing a variety of tourist services and meeting passenger transit needs. Only by coordinating port policy with the goals and actions of overall economic policy and doing it on a regular basis can the passenger port system develop optimally. Ports are unique in that they are not a goal in themselves, but rather are created to fulfil the needs of users, therefore everyone who benefits from them must be concerned about their business operation and development. An increasing number of research have dealt with uncertain fuzzy situations by applying fuzzy set theory, as stated in this (Adler and Berechman, 2001) work, a theory dubbed fuzzy by (Zadeh, 1965), and (Bellman and Zadeh, 1970) presented the decision-making approach in fuzzy environments. Based on such activities, this study employs fuzzy decision-making theory to account for the evaluators' probable subjective judgments when assessing ferry service quality. This method for determining the quality of ferry service can be made more objective. Customer perceptions are used to assess the quality of a ferry's service (Ha, 2001). The following are the applications of fuzzy MCDM in this study. The methodologies for evaluating service quality are divided into two areas. The processes for gaining performance for each criterion are described in the first subsection, while the processes for obtaining level and degree of satisfaction are explained in the second.
And, just as the questionary survey, they gain level and degree of pleasure using this theory. This research adds to the body of knowledge in the hospitality and tourism marketing fields, particularly in terms of how the ferry service might be improved. The outcomes of the fuzzy number and language level definitions, as well as their membership acts as ways for measuring service excellence. The findings also assist the ferry firm in gaining a better understanding of how clients perceive their services.
Methodology
The techniques for gathering and interpreting data are referred to as methodology. Our study design includes the development of research methods. We will make two major options when planning the methods: First, we must decide how we will gather data. Decide how we'll analyses the data next. A field assessment was carried out to determine whether Sadarghat Launch terminal service area amenities exist in Dhaka city at the research location. The information was gathered by hand. MS Excel and Google Spreadsheet were used to analyses the data. A questionnaire survey was used to assess the quality of the launch terminal service.
Methodology Flow Chart: First we select a topic named: A study on the service quality of launch terminal based on passengers satisfaction at Sadarghat, Dhaka. By selecting the area we move into our next work Preliminary Survey.
Topic Selection: First we select a topic named: A study on the service quality of launch terminal based on passenger’s satisfaction at Sadarghat, Dhaka. By selecting the area, we move into our next work Preliminary Survey.
Preliminary Survey: On preliminary survey we select some three-launch terminal which are, Narayangonj Launch Terminal Maowa Launch Terminal and Sadarghat Launch Terminal. Watching the importance of Launch terminal, we choose the Sadarghat Launch Terminal because it is the most crowded and over populated launch terminal in Dhaka.
Site Selection: The first step in preparing a dissertation is to choose a research topic. It is critical for anyone to select a study topic that is both professionally and personally intriguing to them. Sadarghat Launch Terminal, Dhaka is the area mentioned in the title and objectives. Sadarghat Port, also known as the Dhaka City River Front, is one of Dhaka's most dynamic areas, located on the river Buriganga in the southern portion of the city. The Sadarghat River Boat Terminal is one of the world's largest river ports. Every day, about 300 large and small passenger river boats (powered) depart and arrive at the terminal with an average of 500 people per hour. According to officials at the facility, 1,50,000 people utilize the terminal on a daily basis for departure and arrival. Hundreds of country boats, packed with passengers and goods, cross the river at this point. Sadarghat port has always existed, legally or informally, throughout the development of Dhaka as a metropolis. It has long played a critical role in connecting the city to the rest of the country. Thousands of people visit it every day, not only to transition, but also to participate in a plethora of socioeconomic activities that have directly or indirectly influenced the urban morph of old Dhaka. It has a significant impact on the urban fabric, not only as a transitional hub, but also as a focal point for a variety of activities generated by or associated to Sadqarghat. Particularly surrounding the riverbank are the Arot's or warehouses, markets, hotels, retail establishments, and many others.
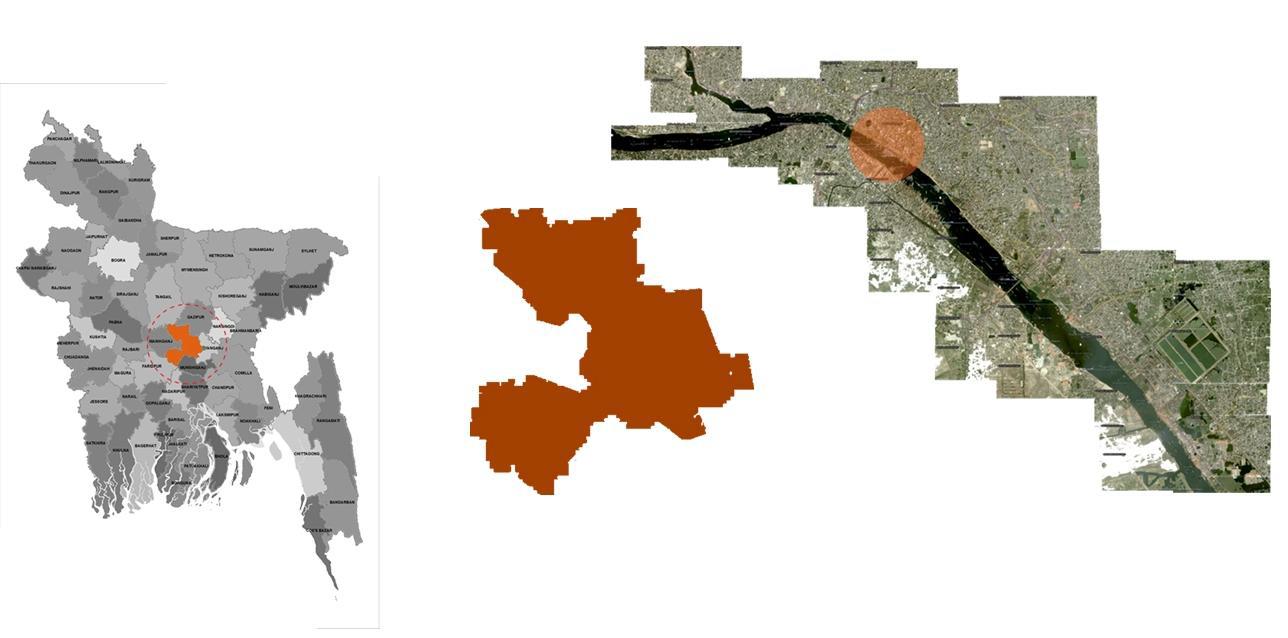
Figure 1: Site Selection.
Field Survey
During covid-19 we made our field survey in Sadarghat Launch Terminal .We made our field survey into two ways. One is Questionnaire Survey and other is Photographic Survey. Based on the field observation and reconnaissance several draft questionnaires were prepared. These questionnaires were tested, verified and cross-checked for its efficiency, and final questionnaires were prepared after wards. In questionnaire survey we made 24 questions and asked this question; passengers and staffs. On the other hand we did photographic survey by taken photo of launch terminal. From photographic and questionnaire survey we collect our data so that we could analysis the data and make a result.
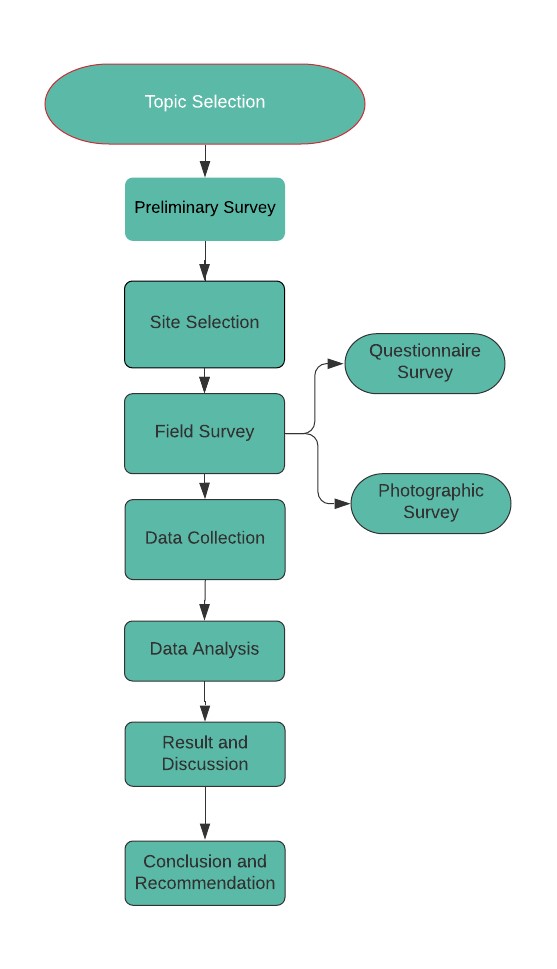
Figure 2: Methodology of flow chart.
Results
We divided the questions into five categories in the questionnaire survey: tangibility, reliability, responsiveness, assurance, and empathy. We can determine the good and bad service quality from this.
Physical facilities, equipment, persons, and materials that can be perceived by the five human senses are referred to as tangibility. Reliability is defined as the supplier's ability to perform the service in a safe and efficient manner. It depicts dependable performance that is devoid of non-compliance and that the user can rely on. Without the need for rework, the supplier must deliver what was promised. The availability of the provider to attend voluntarily to users, offering a service in an attentive manner, with precision and speed of response, is referred to as responsiveness. It concerns the institution's workers' availability to assist users and deliver fast service; Assurance is defined as the courtesy, knowledge, and competence of personnel to transmit trust. Empathy: refers to the ability to show interest and personal attention, and is related to whether the organization cares about the user and assists him in a personalized manner. Accessibility, sensitivity, and effort in understanding the needs of users are all examples of empathy.
Data Collection
The study used qualitative and quantitative data to assess the quality of passenger service at the launch terminal. Qualitative data is adaptable and can be collected from small groups. Quantitative data, on the other hand, may be utilized to systematically characterize enormous collections of things and produce repeatable knowledge. The study attempted to determine the current service quality of the launch terminal using a questionnaire poll of 100 passengers.
|
Table 1: Passenger’s categories and Percentage |
|
|
Different Categories of passengers |
Percentage |
|
Male |
70.5 % |
|
Female |
29.5% |
|
Age Range |
30 to 40 |
|
30 to 40 age range |
55.5% |
|
Students |
17% |
|
Salesman |
29% |
|
Service Holders |
18% |
The passenger travelling by Sadarghat Launch Terminal are Male (70.5%) and compared to female (29.5%).The middle age range person between 30 to 40 age passengers percentage is 55.5%. Also from our survey it is revealed that there are students (17%), Salesman (29%), Service Holders (18%). The percentage of financially solvent people and disabled people are negligible from the perspective of using Launch as a mode of transport by occupation. Income assessment shows that low income groups (whose incomes are less than 25,000 BDT) prefer to travel by launch (70%), while moderate or high income groups (whose incomes are greater than 25,000 BDT) are not very interested travelling by launch.
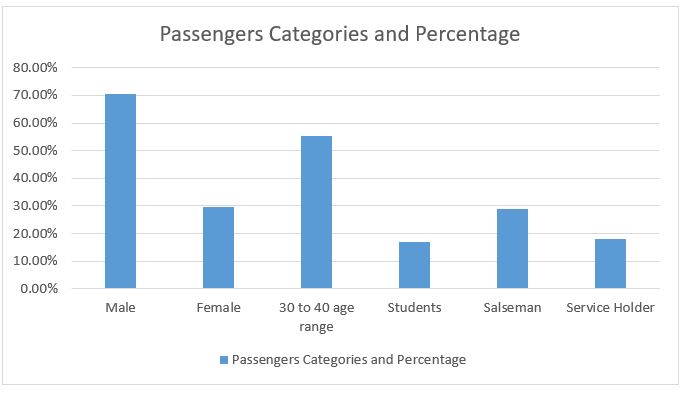
Figure 3: Passengers Catagories and Percentage.
Data Analysis
The Quay, according to the findings of this investigation, has a number of issues. Passengers must wait in the waiting room for their meal after purchasing tickets. According to our survey, 17% of respondents considered the waiting room was too small. In addition, there are no toilets for youngsters. Passengers are dissatisfied with the docking mechanism as they step onto the Deck to board their ship because it is only average (50 percent ). Despite the fact that the terminal, waiting area, and deck are all rusted, they are fully functional (very poor-quality 50 percent). The Ministry of Shipping Authority proposed, among other things, maintaining a waiting room area and ensuring the cleanliness of the Deck and waiting room. Government initiatives suggested include increasing the number of bollards, improving the lighting system, and improving the dock-to-dock junction. Make your own canteen if there isn't one already. It's past time to take the necessary steps to enhance revenue by increasing the exposure of this maritime transportation system.
|
Table 2: Field observation of Sadarghat Launch Terminal |
||
|
NO. |
Categories |
Ratio |
|
1 |
Ticket counter |
12 |
|
2 |
Washroom( VVIP) |
0 |
|
3 |
Washroom (Common) |
8 |
|
4 |
Washroom for disable person |
1 |
|
5 |
Security Booth(Male Police) |
2 |
|
6 |
Security Booth(Female Police) |
0 |
|
7 |
Canteen |
0 |
|
8 |
Parking slot |
1 |
|
9 |
CCTV |
42 |
|
10 |
Waiting Room (VVIP) |
1 |
|
11 |
Waiting Room first class |
2 |
|
12 |
Waiting Room General |
3 |
|
13 |
Schedule Board |
0 |
|
14 |
Station Ramp |
12 |
|
15 |
Bollard Quantity |
219 |
|
16 |
Platform |
12 |
|
17 |
Charging Port |
1 |
|
18 |
Brest Feeding Room |
2 |
|
19 |
Staff Room |
12 |
|
20 |
Information Center |
1 |
Sadarghat Launch Terminal's service quality needs to be improved. The worst case scenario, according to the report, is the dock railing system, and the next concern is the lack of a canteen. As a result, people are forced to purchase food from hawkers. The hawkers often draw a large crowd... There isn’t any maintenance for hawkers. There is also no mechanism in place to notify passengers when the launch has left or arrived at the quay. There isn’t any other way to go in Barishal or Potuakhali except launch and people have to suffer into their launch journey. It is high time for the government to examine and develop the maritime infrastructure. We gave some ideas for how to make this a more equitable scenario.
|
Table 3: Summary table on the questionnaire survey at Sadarghat |
|||||||
|
|
Service Quality Variable |
Very Poor |
Poor |
Average |
Good |
Excellent |
Comments |
|
Tangibility |
Ticket Counter |
0% |
10% |
15% |
55% |
25% |
In tangibility cleanliness and lighting system is poor on percentage. It should be improved. On the other side the ticket counter system, toilet facility and waiting room space is better on percentage. |
|
Toilet Facilities |
10% |
15% |
35% |
40% |
0% |
||
|
Lighting System |
20% |
25% |
50% |
5% |
0% |
||
|
Waiting Room Space |
17% |
11% |
33% |
39% |
0% |
||
|
Cleanliness |
30% |
50% |
15% |
5% |
0% |
||
|
Reliability
Reliability |
Docking System |
10% |
20% |
50% |
20% |
10% |
In reliability staff accommodation’s percentage is very poor. It should be improved. The docking, loading and unloading system is average on percentage. It should be improved. |
|
|
|||||||
|
Service Quality Variable |
Very Low |
Low |
Average |
High |
Very High |
||
|
Man Power |
5% |
10% |
20% |
45% |
20% |
||
|
Service Quality Variable |
Very Poor |
Poor |
Average |
Good |
Excellent |
||
|
Fire Extinguisher |
10% |
15% |
25% |
50% |
0% |
||
|
Emergency Service |
10% |
15% |
20% |
50% |
5% |
||
|
Staff Accommodation |
50% |
40% |
10% |
0% |
0% |
||
|
Loading and Unloading System |
20% |
25% |
40% |
15% |
0% |
||
|
Responsiveness |
Dock railing system |
80% |
20% |
0% |
0% |
0% |
In responsiveness dock railing system, Canteen facilities is very poor in percentage. It should be improved. Also the snapback zone, dock to dock joint is poor in percentage. It should also be improved. |
|
Dock to Dock joint |
20% |
55% |
25% |
5% |
0% |
||
|
Service Quality Variable |
Very Low |
Low |
Average |
High |
Very High |
||
|
Snapback Zone System |
30% |
50% |
15% |
5% |
0% |
||
|
Hawkers volume |
10% |
20% |
60% |
10% |
0% |
||
|
Service Quality Variable |
Very Poor |
Poor |
Average |
Good |
Excellent |
||
|
Security for Passenger |
15% |
20% |
40% |
15% |
10% |
||
|
Canteen Facilities |
100% |
0% |
0% |
0% |
0% |
||
|
|
Service Quality Variable |
Very Low |
Low |
Average |
High |
Very High |
|
|
Assurance |
Quantity of Station Ramp |
0% |
10% |
15% |
30% |
45% |
In assurance, the bollard quality and mooring ropes quality is very poor in percentage.It should be improved. |
|
Bollard Quantity |
0% |
10% |
15% |
40% |
35% |
||
|
Mooring Ropes Quality |
50% |
35% |
15% |
0% |
0% |
||
|
Service Quality Variable |
Very Poor |
Poor |
Average |
Good |
Excellent |
||
|
Bollard Quality |
35% |
40% |
10% |
15% |
0% |
||
|
|
Service Quality Variable |
Very Poor |
Poor |
Average |
Good |
Excellent |
|
|
Empathy |
Facility For Disable Person |
10% |
15% |
20% |
50% |
5% |
In empathy, terminal maintenance and watchtower service is average in percentage. It should be improved |
|
Terminal Maintenance |
20% |
25% |
40% |
15% |
0% |
||
|
Watchtower Service |
20% |
40% |
30% |
10% |
0% |
||
Discussion
A model for improving the service quality of the launch terminal can be established. Based on the results of our survey, we strongly suggest the following.
Ticket Counter System
Although there is an online ticketing app called "Jaljatra," it is frequently unavailable. There is also no ticket prize billboard. It is critical to construct a billboard that advertises the destination and prize so that travellers may purchase tickets easily.
Waiting Room
There is no waiting area for VIP passengers. As a result, having a VIP passenger waiting space is critical. It's also a good idea to give passengers with any book storage or newspaper. In addition, there is no air conditioning in the first-class waiting room, and there are only two fans in the first-class waiting room. Even as we were doing our poll on Covid -19, a dog was sleeping in the first-class waiting area. It's awful because everyone is acting as if the incident never occurred. People continue to moan about how much humans are suffering as a result of covid-19, but no one seemed to care about animals. It's a pity that we talk about equality yet don't give a damn about animals.
Toilet Facility
It is critical to expand the number of available toilets. There is also no VIP restroom, therefore one will have to be built. In addition, there is no toilet cleaner within the toilet (during the Covid 19 session). There is a requirement for a children's toilet.
Bollard Quality
Inside the quay, there are 219 bollards, with over 75% of them being of poor quality. Also, because most of the bollards are rusted, check to see if the paint or powder coat has been scratched.
Storage Facilities at Terminal
At each level of each Terminal, sufficient storage facilities must be incorporated to meet the functional needs of the operational Terminal as well as the demands of the maintainers. In most cases, storage space will be created in the following areas. For paper and customer care products, there is a customer service centre at the entrance/concourse level. Stores connected to retail activities are located at the entrance/concourse level of a retail service store.
Docking System
The vessel's docking configuration will be primarily determined by it. Side-loading is common on passenger ferries, which can be accommodated by parallel or linear berthing facilities. Although the docking system is adequate, the station ramp used by passengers to access the deck from the ship is made of wood. It needs to be updated. The mooring ropes frequently need to be replaced because they are weak, and the ship rattles when it arrives at its destination (deck) because the mooring ropes are not adequately tightened with bollard.
Page: 36 www.raftpubs.com Lighting System
Medical assistance is not available. As a result, providing a medical emergency service for passengers is critical.
Emergency Service
There is no medical assistance available. As a result, it is crucial to provide a medical emergency service for passengers.
Fire Extinguisher Facility
Since there are only six fire extinguishers, more fire extinguishers are needed.
Cleanliness of platform
For waste products, there isn't enough waste bin. It's also vital to create a rule that anybody who throws trash on the platform or deck will be fined.
Dock Railing System
vzIt is critical that the dockyard be equipped with a railing system.
Dock to Dock joint
A dock bridge that spans the gap between two dock sections. The dock bridge is made up of two connecting plates and a flexible material that runs between them. The flexible material is composed of a water-resistant material, and each of the connector plates is made of a corrosion-resistant material. Because there was a gap between the docks during our survey, they need to be reconnected. There was just one Dock Bridge between the two connecting joints. As a result, the dock bridge will need to be enlarged.
Mooring Ropes Quality
Mooring lines are used to secure vessels near to a dock, pier, or terminal. The dockyard's mooring ropes are of poor quality. In addition, installation should be carried out by a skilled personnel. Errors during the installation include incorrect drum winding and the addition of twists. Twists reduce the rope's strength and increase the risk of it breaking. The rope will not twist if you use a revolving platform. The use of two colors for simple detection of the twist can aid in the observation of the twist. It's also a good idea to utilize the same ropes in all places when the ropes function in tandem.
Snapback Zone
Snapped line wrapped around a lead that is under tension can be fatal. Snapback zone isn't marked with paint or a sign. As a result, the snapback zone on the deck plating must be painted (Azad, A. K., 2009). When the ship is about to dock or depart, place a professional man in the snapback zone.
Loading and Unloading System
No freight cranes, side-loading systems with conveyors, side shifters, or elevators are available. It is critical to implement that system. Using a variety of truck unloaders as part of the loading and unloading system is also a good idea. The current passenger clearance mechanism is insufficient. Everyone can enter the terminal with a 10 taka ticket. The terminal has 12 entrances, although only two have security officers. The remaining ten doors must be guarded.
Conclusion
Sadarghat Launch Terminal's service quality needs to be improved. The worst-case scenario, according to the report, is the dock railing system, and the next concern is the lack of a canteen. As a result, people are forced to purchase food from hawkers. The hawkers often draw a large crowd... There isn’t any maintenance for hawkers. There is also no mechanism in place to notify passengers when the launch has left or arrived at the quay. There isn’t any other way to go in Barishal or Potuakhali except launch and people have to suffer into their launch journey. It is high time for the government to examine and develop the maritime infrastructure. We gave some ideas for how to make this a more equitable scenario.
Limitation and Future Study
The questionnaire survey would always be the same whenever anyone research about the service quality of Sadarghat Launch Terminal, so for this reason whoever next time go for further research they can use this same question and also put them questionary into different method. Such as Data Envelopment Analysis (DEA). By using this method into the service quality researcher can come to valuable conclusions in evaluating the service quality. Also, another method name “FUZZY DECISION MAKING” approach in evaluation ferry service. Furthermore, making more questionnaire can make the result more accurate.
Acknowledgment
Thanks to our supervisor Anika Nowshin Mowrin for helping us to undertake this research.
References
1. Hasan M, Karmaker K. 2019. Factors Influencing Passenger Satisfaction toward Waterway Transportation. International Journal of Science and Management Studies (IJSMS). 1-8.
2. de Oña J, de Oña R, Eboli L, Mazzulla G. 2013. Perceived service quality in bus transit service: A structural equation approach. Transport Policy. 29: 219-226.
3. Hadiuzzaman D. 2016. Assessment of perceived service quality in marine passenger vessel using structural equation approach.
4. Khan MI, Das T, Rahman F, Shimu TH. 2018. A Structural Equation Approach In Modeling Perceived Service Quality Of Passenger Ferry. Management Research & Practice. 10.
5. Azad AK. 2009. Riverine Passenger Vessel Disaster In Bangladesh: Options For Mitigation And Safety. Dissertation for the Degree of Master in Disaster Management, BRAC University, Dhaka, Bangladesh.
6. Karmaker MHK. 2019. Factors Influencing Passenger Satisfaction toward Waterway Transportation.
7. Rahman A. 2017. Business model for bus operation in Dhaka city under proposed brt system scenario.
8. Berry LL, Zeithaml VA, Parasuraman A. 1990. Five imperatives for improving service quality. Sloan Management Review. 31. 9-38.
9. Perçin S. 2018. Evaluating airline service quality using a combined fuzzy decision-making approach. Journal of Air Transport Management. 68. 48-60.
10. Baccarani C, Ugolini M, Bonfanti A. 2015. A conceptual service quality map: The value of a wide opened perspective. In 13th Toulon-Verona Conference, Organizaqtiuona Excellence in Services.
11. Berger C, Blauth R, Boger D. 1993. Kano?s methods for understanding customer-defined quality. The Center for Quality Management Journal. 2.
12. Bamberg S, Schmidt P. 1998. Changing travel-mode choice as rational choice: Results from a longitudinal intervention study. Rationality and Society. 10. 223-252.
13. Bollen KA. 1989. Structural Equations with Latent Variables. X Ed., John Wiley & Sons Inc. New York. USA. 14. Browne MW, Cudeck R. 1993. Alternative ways of assessing model fit. Sage Focus Editions. 154; 136.
15. Bentler PM, Chou CP. 1987. Practical issues in structural modeling. Sociological Methods & Research.
16: 78-117. 16. Czepiel JA. 1990. Service encounters and service relationships: implications for research. Journal of business research. 20: 13-21.
17. Chiou YC, Chen YH. 2012. Service quality effects on air passenger intentions: a service chain perspective. Transportmetrica. 8: 406-426.
18. Churchill GA, Iacobucci D. 2009. Marketing Research: Methodological Foundation. 10th ed. New York: The Dryden Press.
19. Joreskog KG. 1973. Analysis of covariance structures. In Multivariate Analysis-III, P. R. Krishnaiah, ed. New York: Academic Press. 263-285.
20. Irfan SM, Kee DMH, Shahbaz S. 2012. Service quality and rail transport in Pakistan: a passenger perspective. World Applied Sciences Journal. 18: 361-369.
21. Carmines EG, Zeller RA. 1979. Reliability and validity assessment. 17.
22. Van K, HT, Fujii S. 2008. Psychological effects of travel behavior on preference of residential location choice. Transportation Research Part A: Policy and Practice. 42: 116-124.
23. Central Roads Research Institute (CRRI). 2002. ?Urban Road Traffic and Air Pollution (URTRAP)‘, Final Report, Submitted to Society for Indian Automobile Manufacturer, New Delhi.
24. Crang M, Cook I. 2007. Doing Ethnographies. London.
25. Darling J. 2014. Emotions, encounters and expectations: The uncertain ethics of ?The Field’. Journal of Human Rights Practice. 6: 201-212.